Visual Editor analytics data overlay
Integrate analytics reporting into Visual Editor’s editing environment.
Typically, accessing web and product analytics data requires using specialized expert systems that are out of a content editor's typical workflow and expertise. However, you can make this data easily accessible to all editors by adding an analytics layer to the visual editor.
This integration has another significant benefit: by having analytics data immediately visible on all pages, editors are encouraged to make their work more data-driven, based on real-world signals rather than guesswork.
We have implemented this capability for an example site, pulling data from Google Analytics both at the page level as well as for specific section. Here's how it looks like:
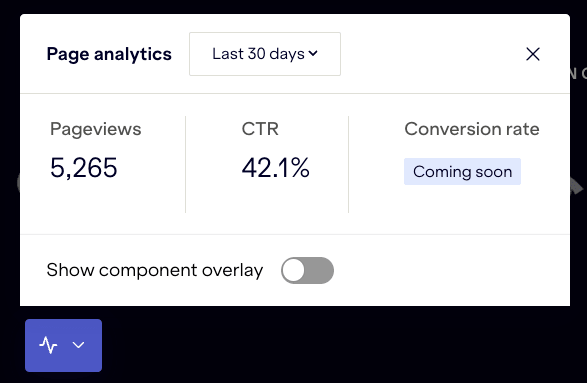
Tip
For a live demo based on Google Analytics, please contact us. Paying customers get access to the source code for this demo.
# Access your analytics data
Ideally, your tool of choice already provides an online API for getting report data (e.g. Google Analytics Data API, Adobe Analytics Reporting API), whether historical (i.e. last X days) or real-time.
If your vendor only allows for exporting data in bulk (typically to cloud storage), you'd need to write your own code to read and serve this data online.
In either case, the client-side should not have the credentials to directly access the analytics tool's API. Instead:
- Create your own API endpoint to expose only needed KPIs. Keep needed credentials only on the server side.
- Your API endpoint and any client-side code should only be enabled in non-production environments. Check-in your code that
process.env.NODE_ENVis not set toproduction.
# Add a data overlay
How you render analytics data depends on the web framework and components you use. Here are a few General guidelines:
- To only show analytics data on the client when your website is running inside Visual Editor, check that the environment variable
process.env.STACKBIT_PREVIEWis defined (note: to maintain business-sensitive data confidential, always also make sure the server does not provide this data in production). - Wrap your page component with a higher-order component to show a floating widget with page level data. Set a high z-index to ensure the widget is visible over all other controls.
- When navigating between pages, ensure data is refreshed.
- Ensure that any errors in fetching data are caught and do not fail page rendering.
- Let content editors control the widget's visibility, plus any other global settings, by creating a dedicated webpage that is quickly accessible with a sidebar button.
To learn more, contact us!
Did you find this doc useful?
Your feedback helps us improve our docs.