For the complete Netlify documentation index, see llms.txt. Markdown versions of this page are available by appending .md to the URL. With Netlify Web Analytics, you can get a deeper understanding of your projects by monitoring trends in site/app visitor activity. Server-side data collection for Web Analytics complies with the General Data Protection Regulation (GDPR), has no impact on site performance, is not stopped by ad blockers, and does not require any extra configuration.
Get started
Section titled “Get started”To enable Web Analytics for your project, go to Logs & Metrics Analytics and select Enable Analytics.
Once enabled for your project, data collection begins once your project is first deployed. Up to 30 days of historical data will be backfilled in your charts.
Charts
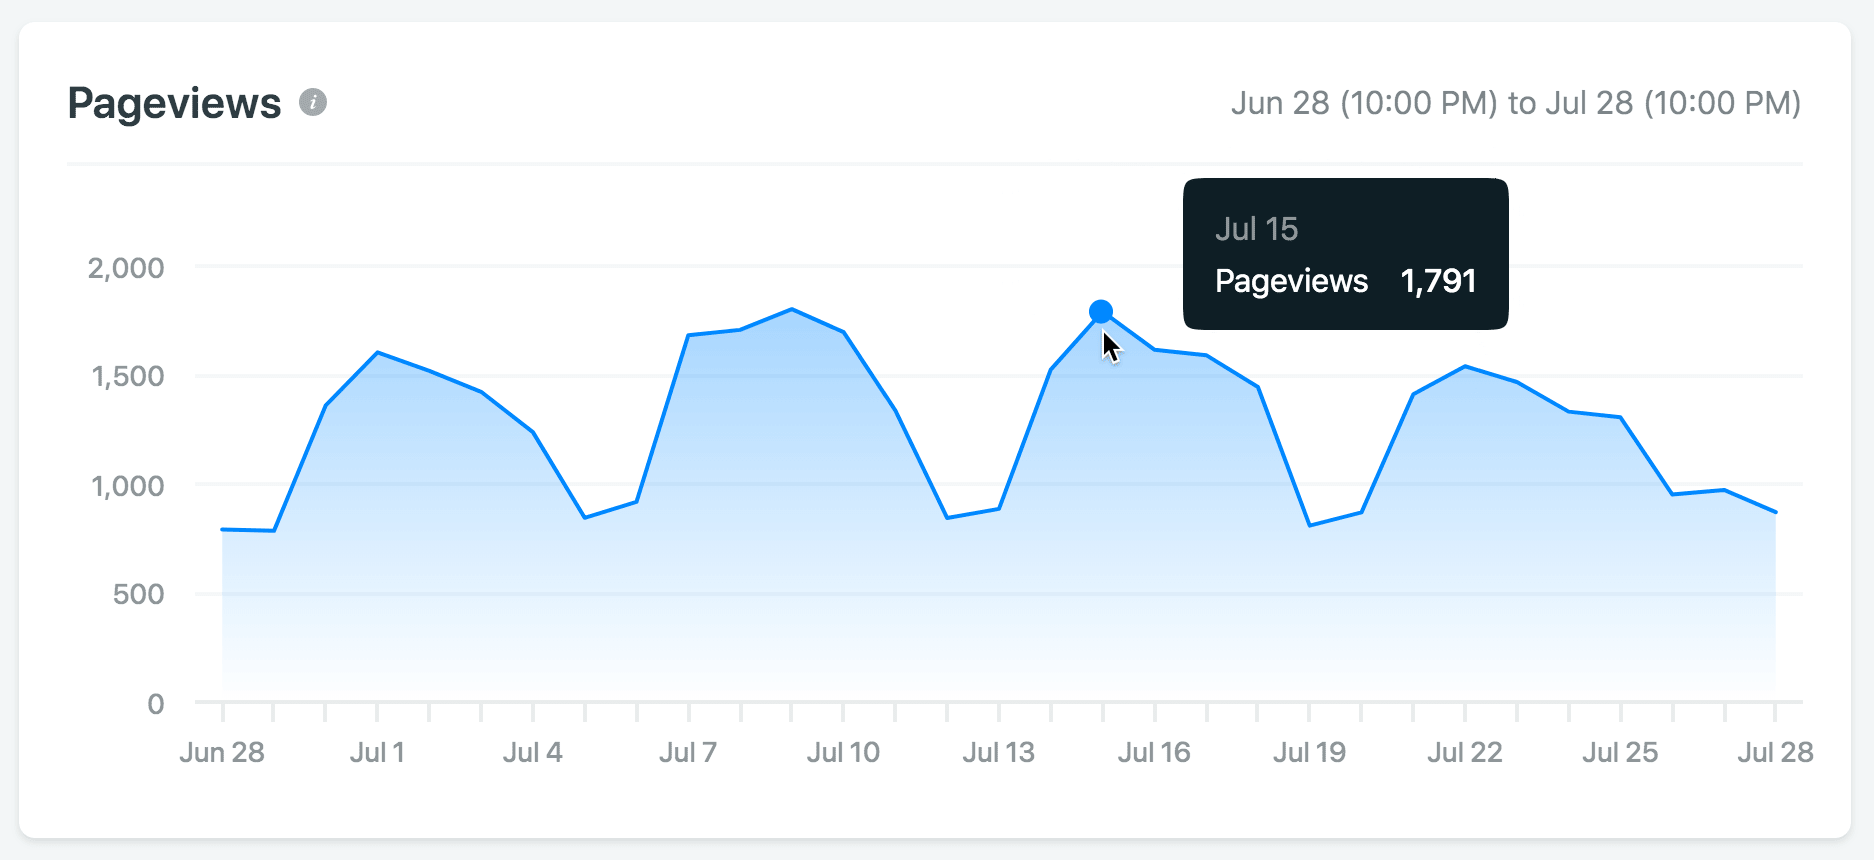
Section titled “Charts”- Pageviews: instances of your project’s pages being served.
- Unique visitors: different IP addresses engaging with your project.
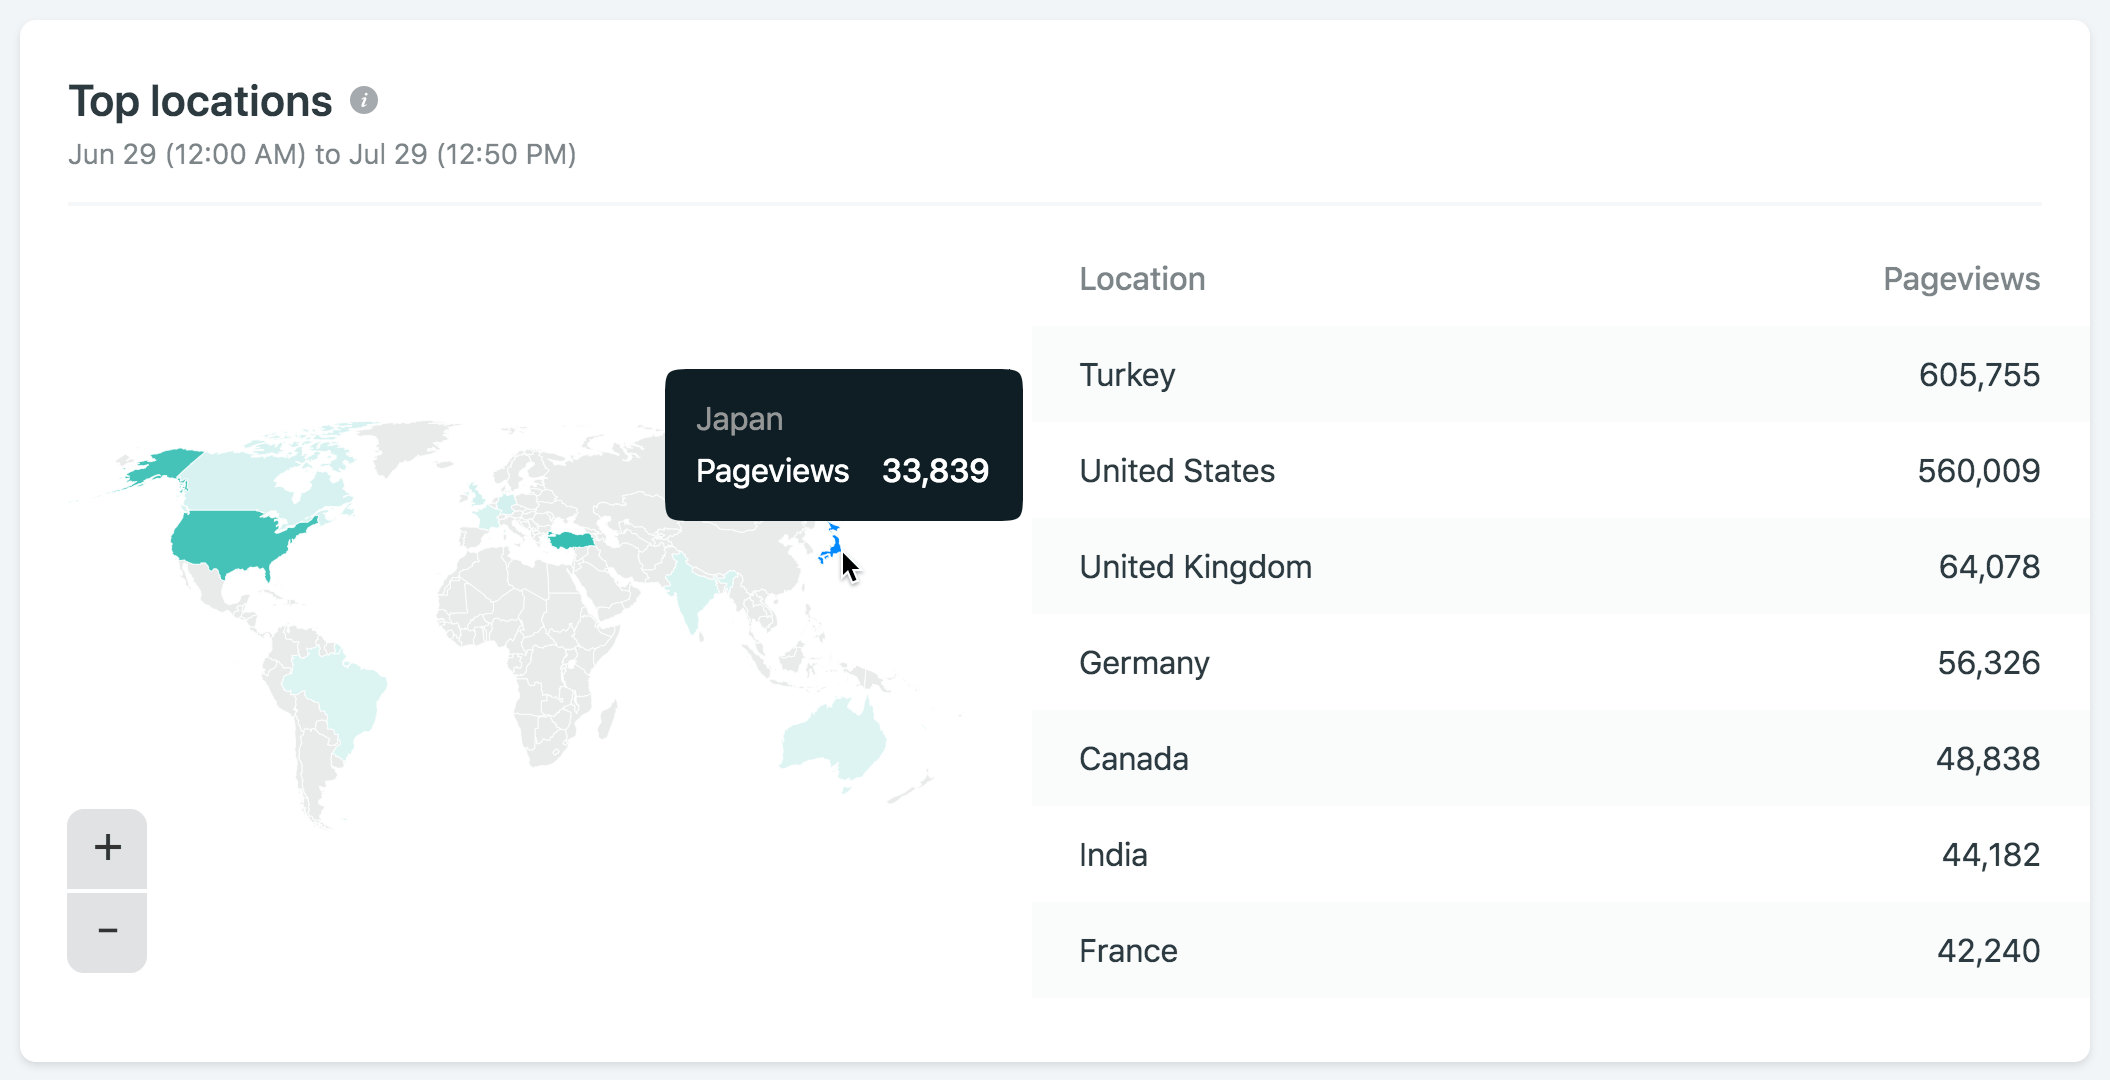
- Top locations: locations where your project has had the most pageviews.
- Top pages: pages of your project that have had the most pageviews.
- Top resources not found: resource requests for your project that returned the most
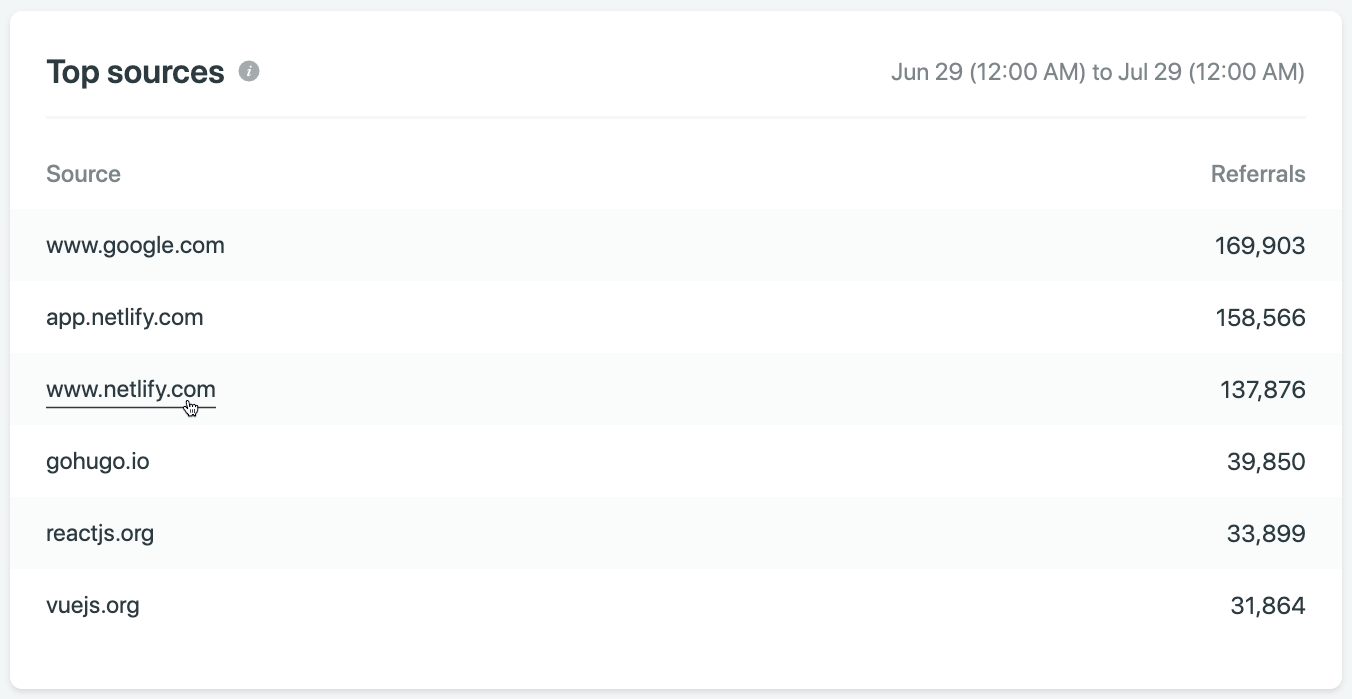
404errors. - Top sources: URLs that generated the most traffic to your project.
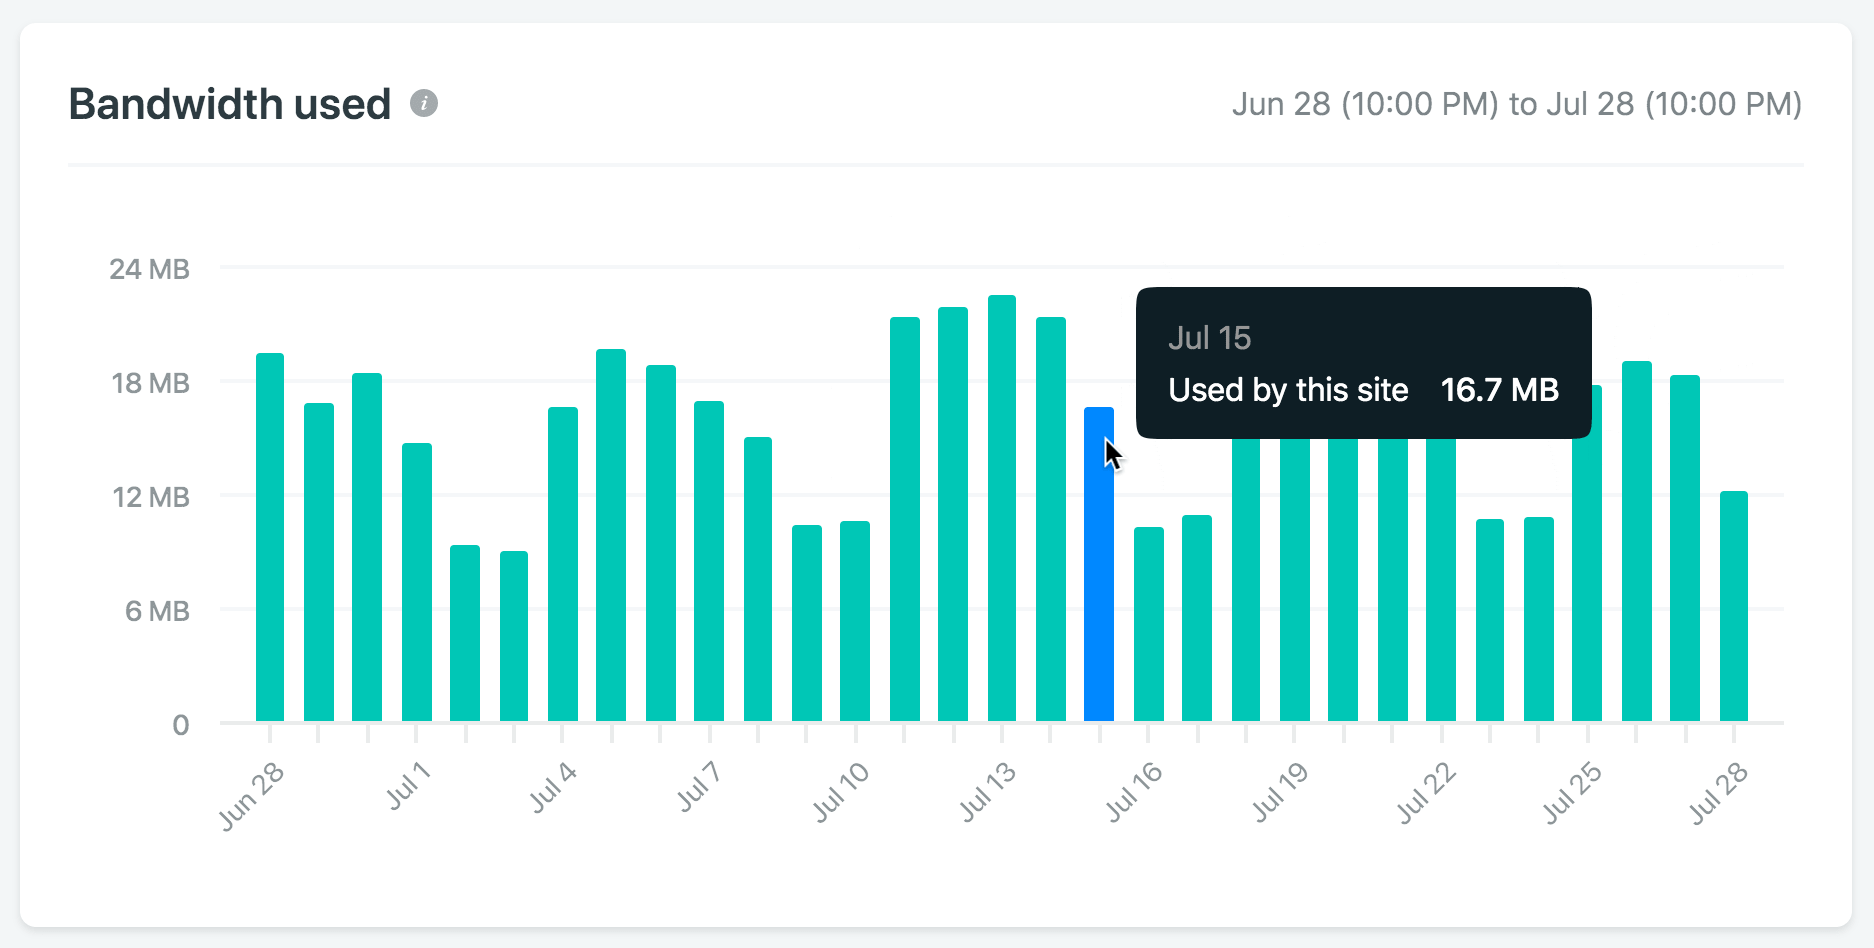
- Bandwidth used: how much data has been served by our CDN for your project.
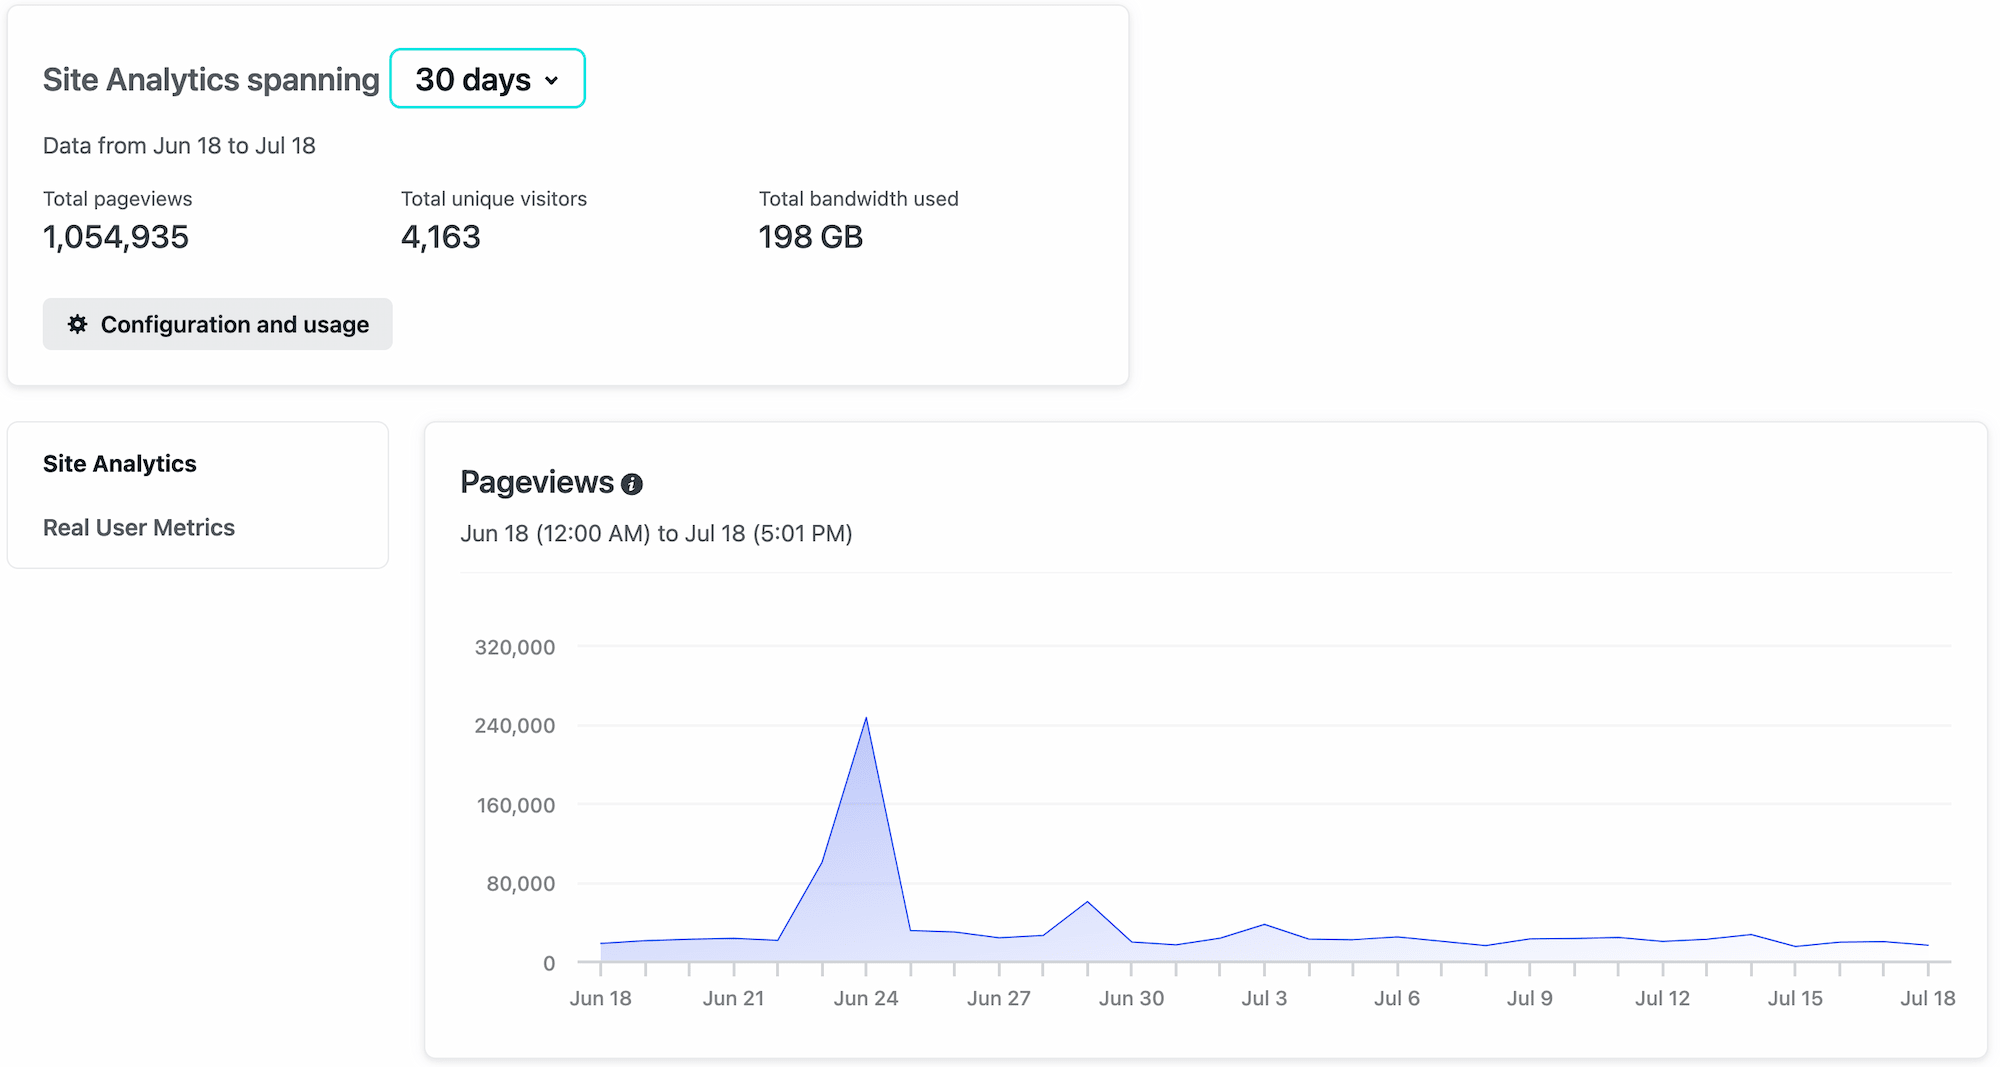
By default, Web Analytics charts are scoped to the last 30 days. Filters are available for other time spans.
The Pageviews and Unique visitors charts plot daily metrics. You can examine the charts to explore day-level details. Data for the current day updates hourly.
In the Top locations chart, you can examine the map to explore pageview counts for all locations.
In the Top pages and Top sources charts, you can select the URL of any source or page to visit it in a new tab. Similarly, in the Top resources not found chart, you can select the URL of any resource to visit the 404 page served for it in a new tab.
The Bandwidth used chart plots daily metrics. You can examine the chart to explore day-level details about your project’s bandwidth usage. Data for the current day updates hourly.
Filters
Section titled “Filters”Filters allow you to check your Analytics data over the span of 30 days, 7 days, or 24 hours.
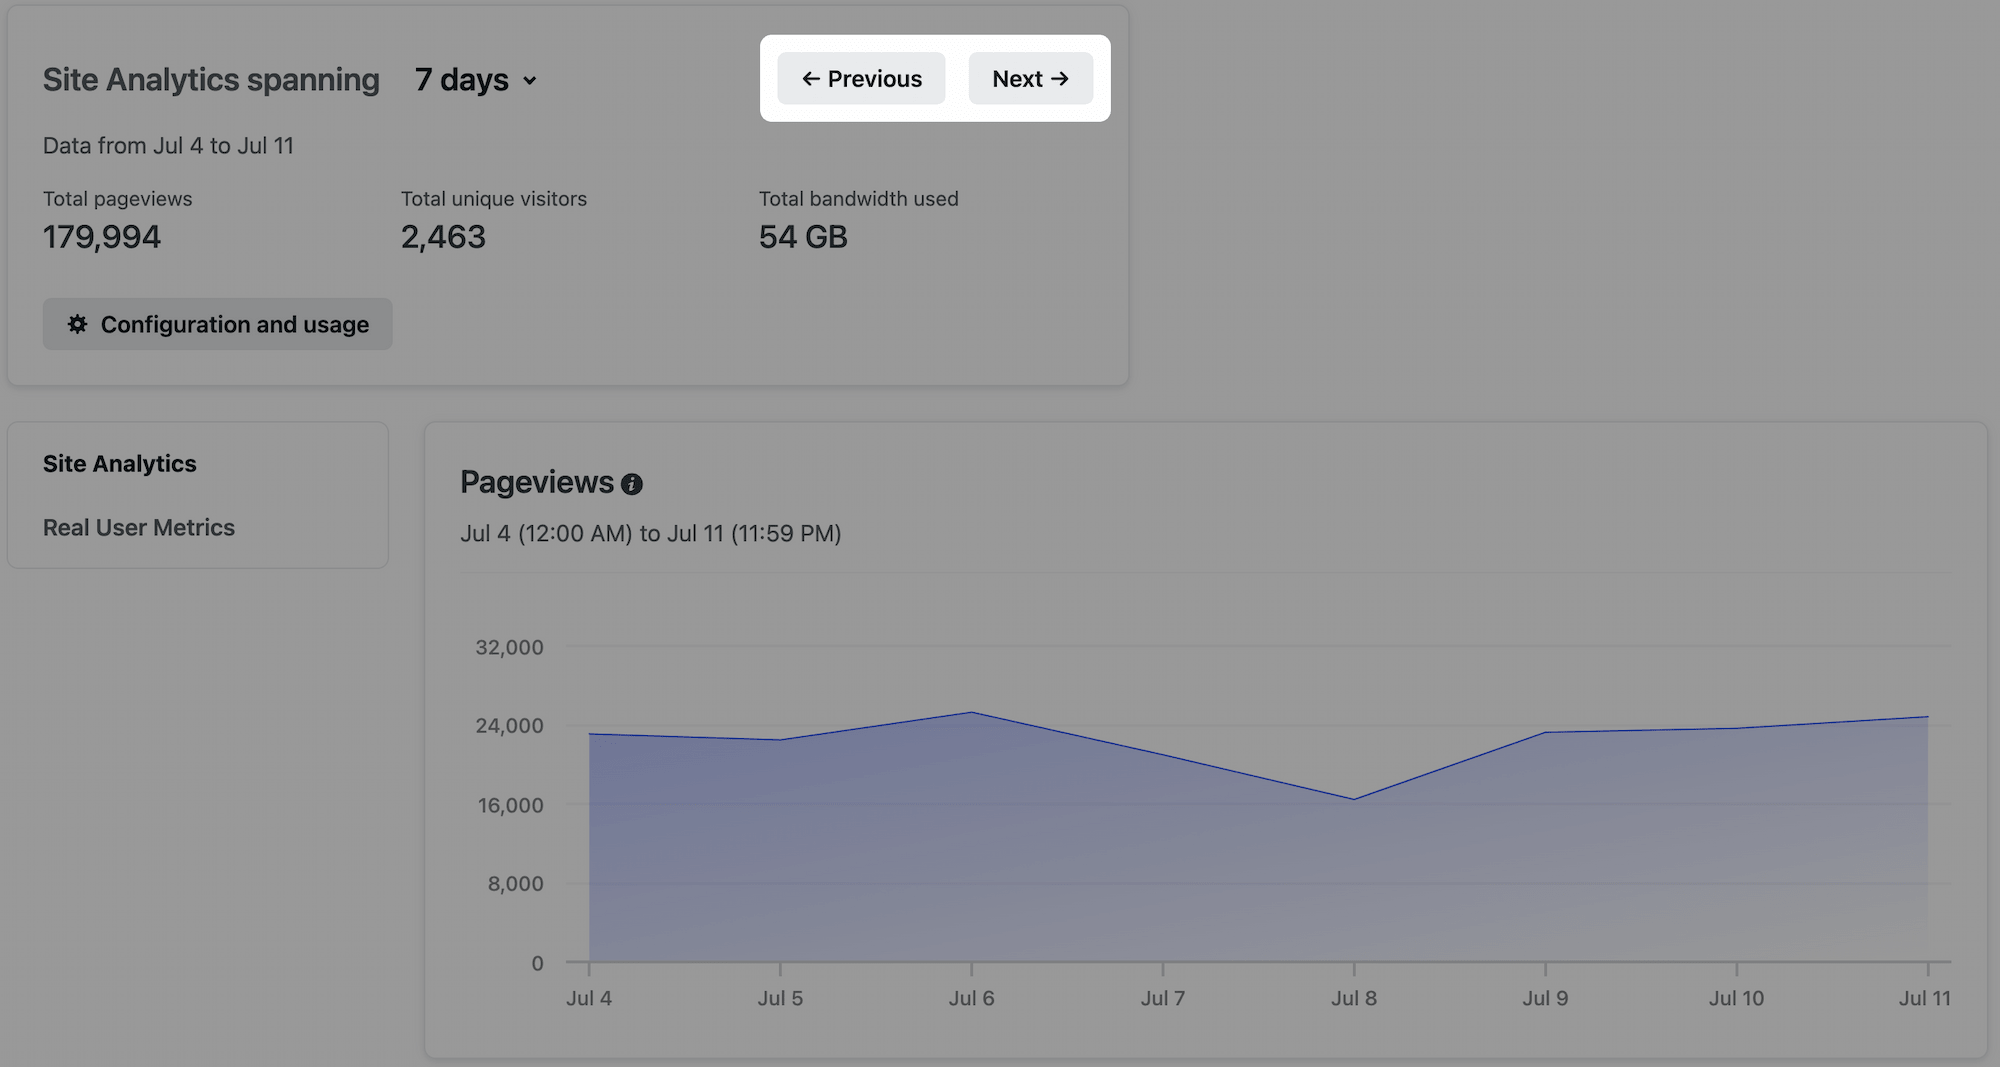
You can review your Analytics data from the last 30 days in 7-day or 24-hour increments by choosing the 7 days or 24 hours filter and then selecting Previous.
30 days filter
Section titled “30 days filter”By default, the Analytics page loads all available data for the last 30 days.
7 days filter
Section titled “7 days filter”To scope Analytics data to the last 7 days, select the 7 days filter. To review data for other 7-day periods within the last 30 days, select Previous.
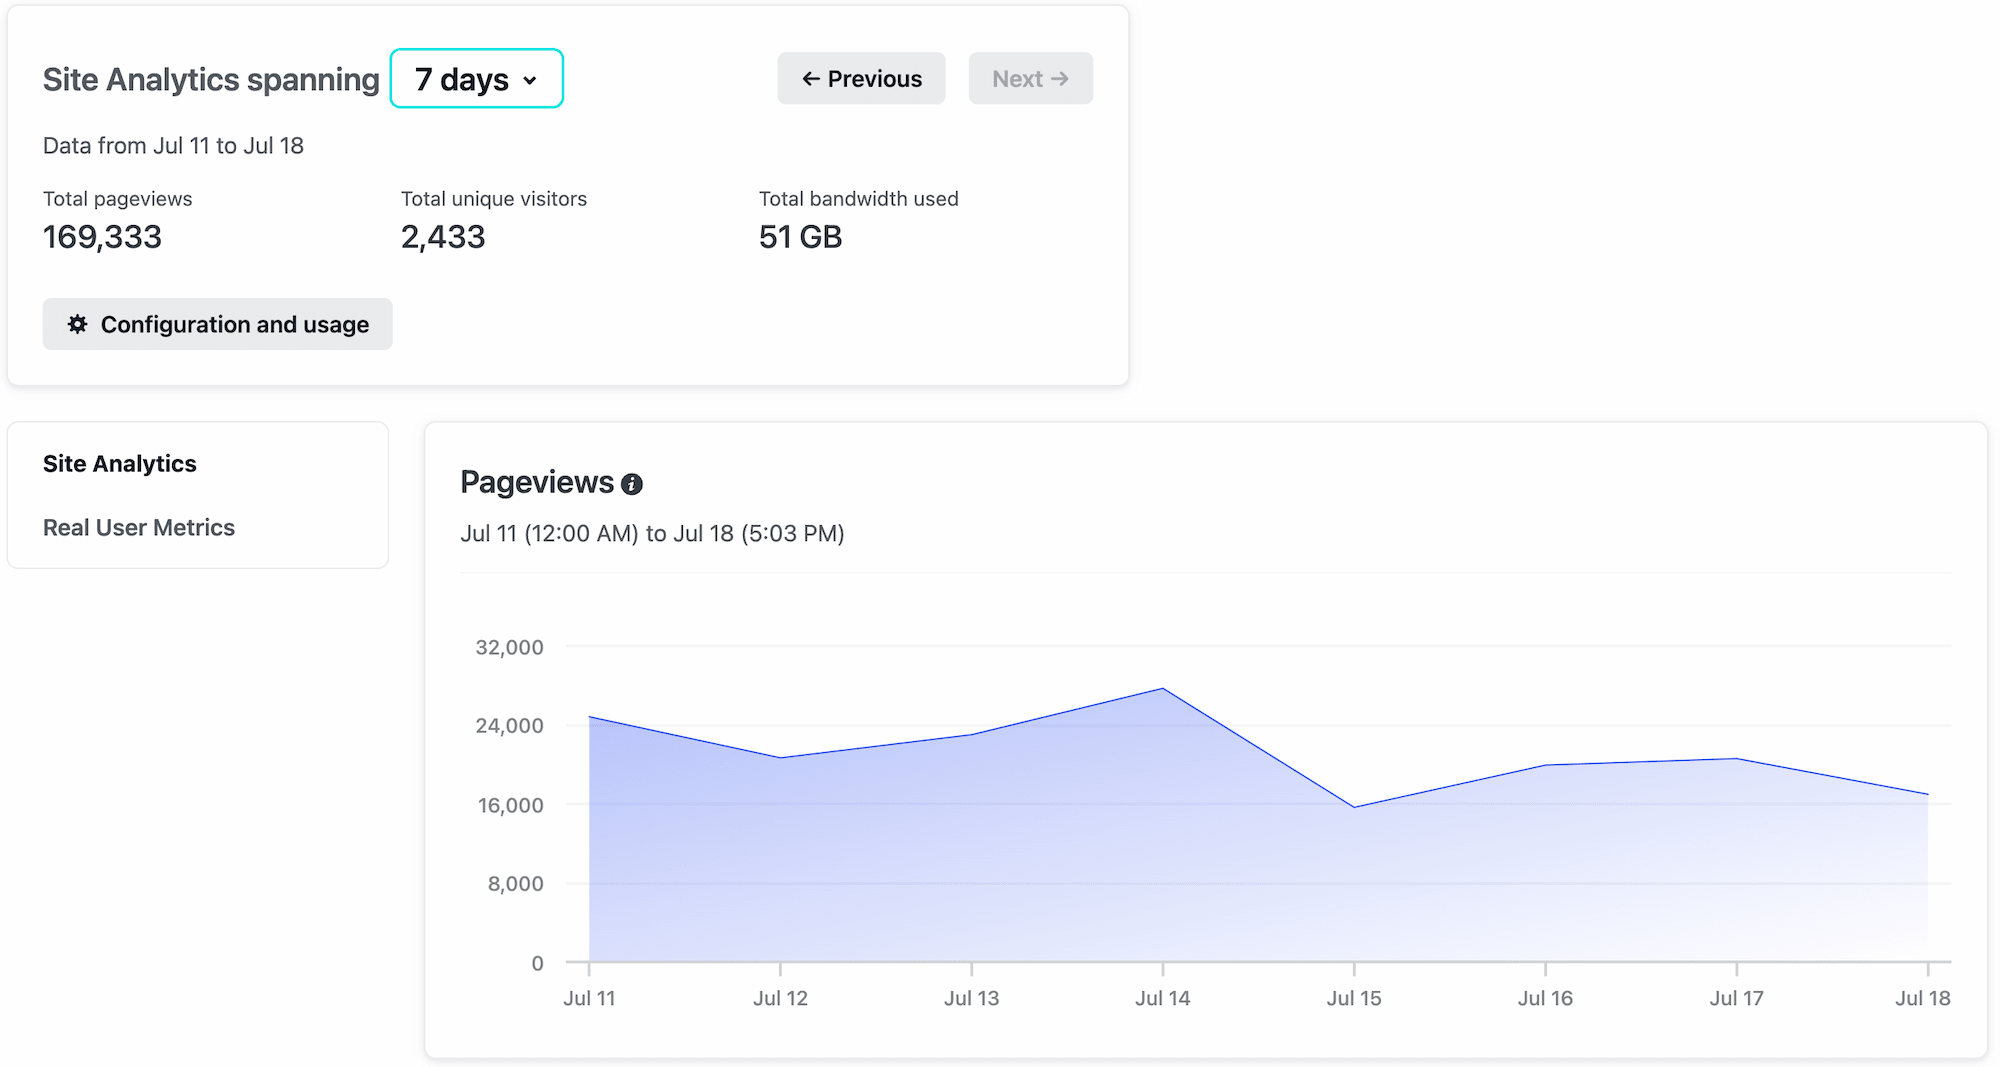
Charts using the 7 days filter plot daily metrics. You can examine the charts to explore day-level details. Data for the current day updates hourly.
24 hours filter
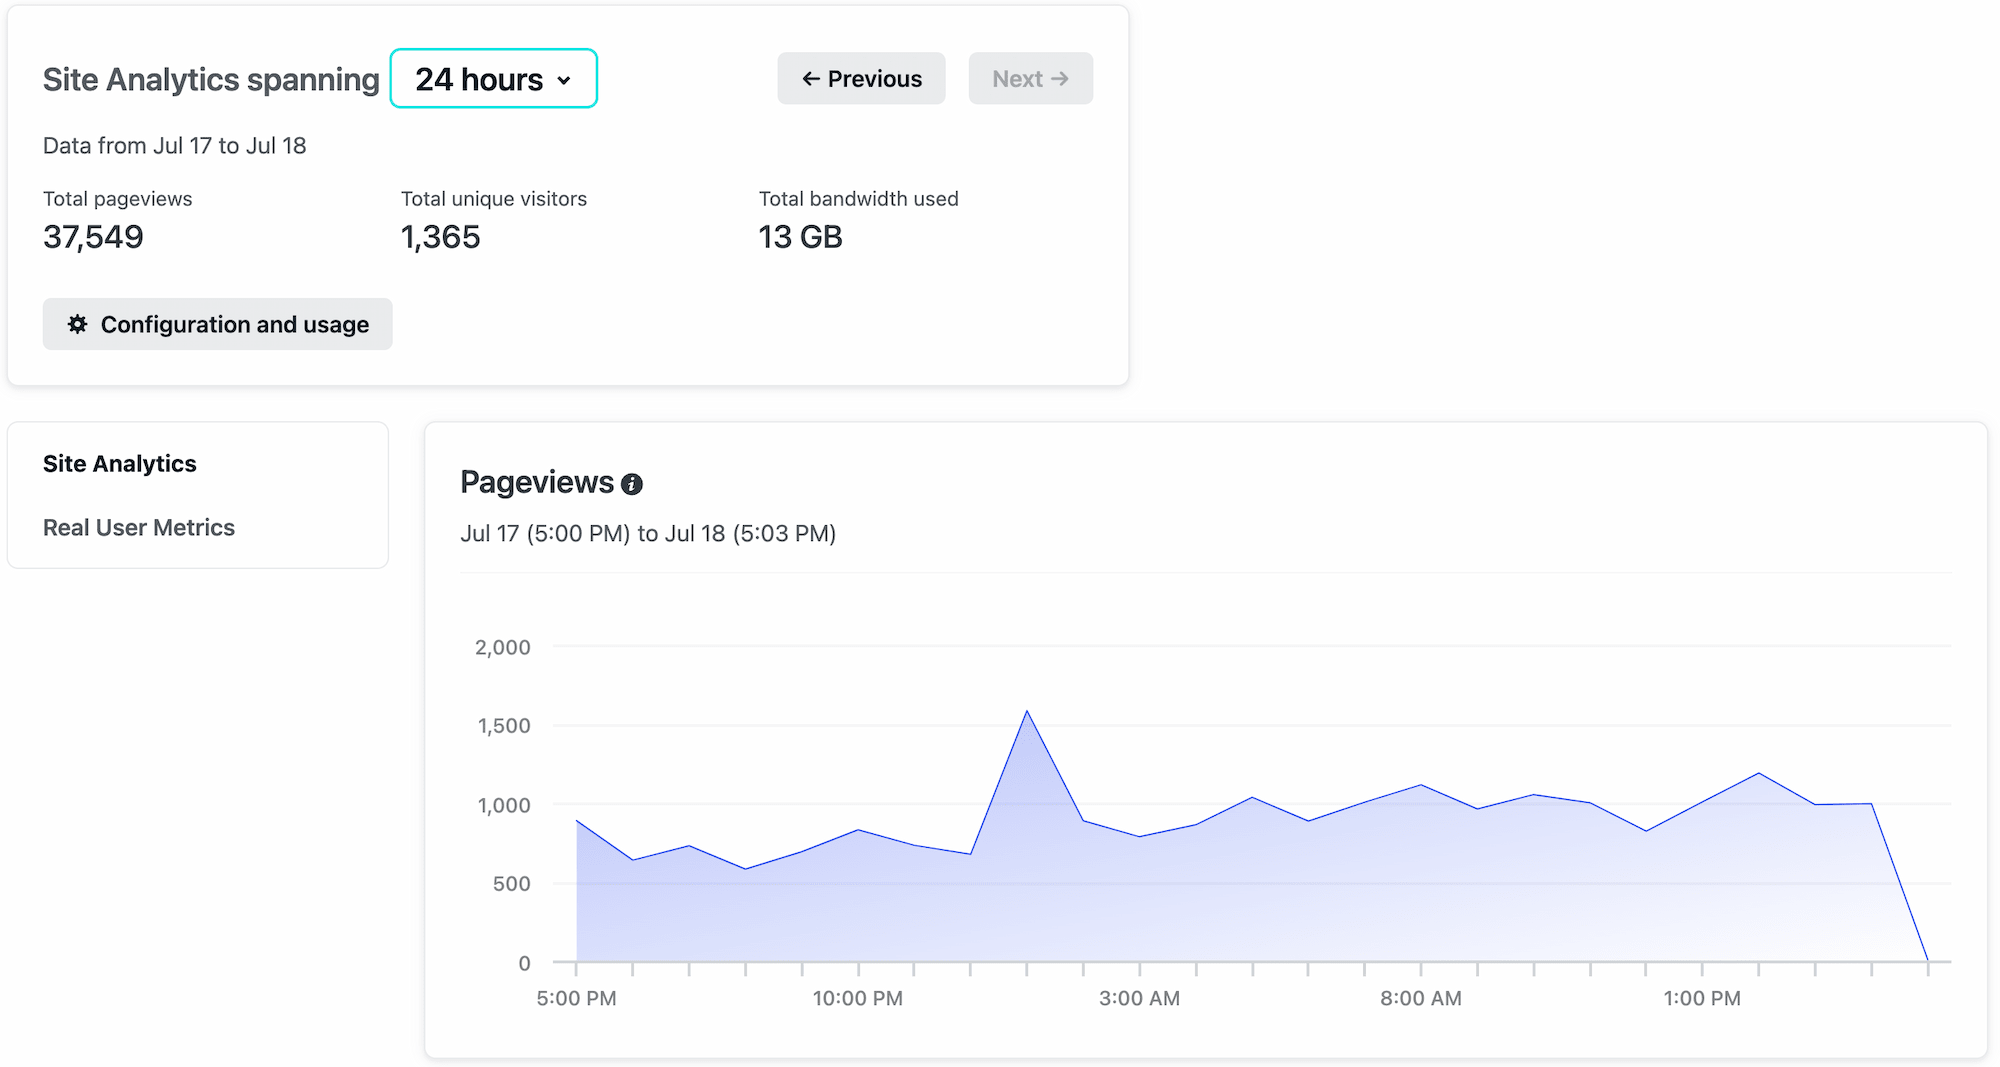
Section titled “24 hours filter”To scope the data to the last day, select the 24 hours filter. Both the range and granularity of the data will update and all data on the page will be scoped to the last day by default.
To review data for other 24-hour periods within the last 30 days, select Previous.
Charts plot hourly metrics. You can examine the charts to explore hour-level details.
Visit our Forums to get inspired, ask questions, and share ideas and feature requests about Netlify Analytics.
Remove Web Analytics
Section titled “Remove Web Analytics”To cancel the Web Analytics service for a project, go to Logs & Metrics Analytics Danger zone. Select Cancel Web Analytics service.
Web Analytics charts for your project will no longer be available.
Did you find this doc useful?
Your feedback helps us improve our docs.