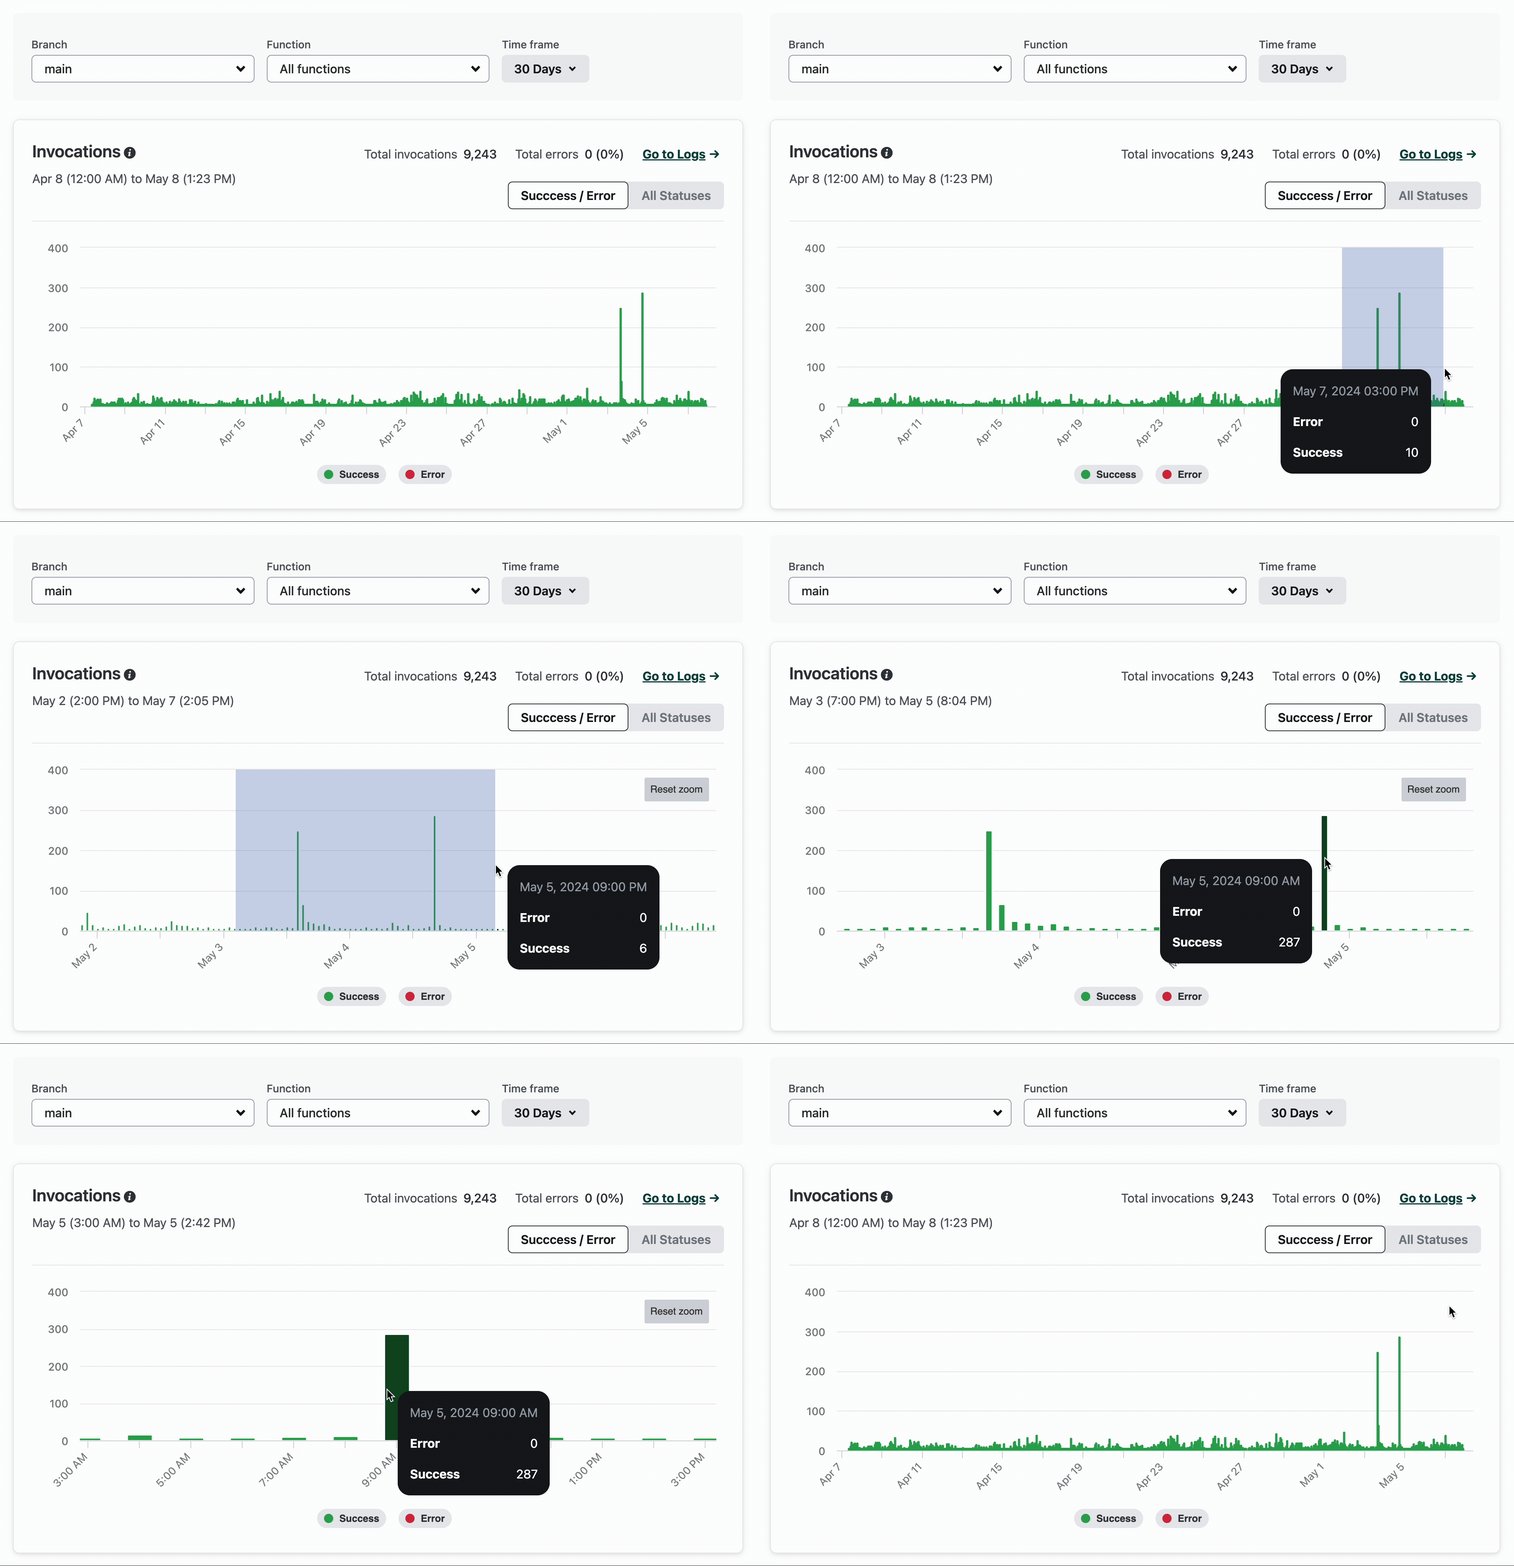
Function Metrics give you insights into the performance, reliability, and usage patterns of functions on your site.

To explore Function Metrics for your site, go to Logs & Metrics Functions.
Use cases
Section titled “Use cases”By analyzing success and error rates alongside other metrics such as invocation count and function duration, you can optimize performance, troubleshoot issues, and make data-driven decisions to enhance the overall quality and user experience of your projects.
- Optimize performance. Identify performance bottlenecks by analyzing function duration metrics. By pinpointing functions with high average durations or extreme long tails (as indicated by p95 and p99 durations), you can target your optimization efforts.
- Troubleshoot errors. Find functions with high error rates and drill into the logs to troubleshoot. By observing error rates over time, you can detect trends, enabling proactive problem-solving before errors escalate. With deploy markers on the timeline, you can discover if a spike in errors is associated with a specific change and then rollback to an earlier deploy while you fix the issue.
- Prioritize development efforts. Understand function invocation patterns to allocate your time more efficiently. By analyzing which low-performing functions receive the most invocations, you can focus on making high-impact improvements.
Metric definitions
Section titled “Metric definitions”- Invocations: requests to your serverless function endpoints. A request to a function path that results in a cached response being served does not count as an invocation.
- Errors: responses from function endpoints with
5xxstatus codes. - Successes: responses from function endpoints with non-
5xxstatus codes. - Average duration: mean compute time.
- p50: 50% of invocations were completed within this time.
- p95: 95% of invocations were completed within this time.
- p99: 99% of invocations were completed within this time.
Filter your data
Section titled “Filter your data”Focus on the events and information that you care about by filtering your data.
Deployed functions
Section titled “Deployed functions”By default, Function Metrics charts include all functions on the production branch. You can change this in a few ways:
- Use the filter menus to pick a different Branch, focus on a specific Function, or do both depending on your needs.

- Select a Function name in the Distribution by function chart to scope the Invocations chart to just that function.

Time frame
Section titled “Time frame”By default, Function Metrics charts are scoped to the last 24 hours. You can change the time frame in a couple of ways:
-
Use the Time frame menu to select a different range. Note that data retention varies by team plan.
-
Zoom in by clicking and dragging your desired range in the Invocations chart.

Response codes
Section titled “Response codes”By default, the Invocations chart is faceted by Success / Error. In these groupings, all 5xx response codes are considered errors and all other response codes are considered successes. You can instead facet the chart by All Statuses for more granular data.
In both cases, you can focus on specific response types with facet filters. Here are some examples:
-
When the chart is faceted by Success / Error, you can filter it to just the Error data. Filtering the chart to just errors can help you identify patterns and trends that might otherwise be too small to detect when successes are also included in the chart.

-
When the chart is faceted by All Statuses, you can filter it to one or more specific status codes, such as
428. Filtering the chart to a specific status code can help you troubleshoot specific scenarios, such as missing preconditions.
You can drill into function logs for more information in a few ways:
- In the Invocations chart, use the Go to Logs link.

- When the chart includes All functions, the link takes you to the function logs index for your site.
- When the chart is scoped to a single function, the link takes you to that specific function’s logs filtered to the same time frame you were exploring in Function Metrics.
- In the Distribution by function chart, use the link on the Errors rate.

- These links take you to the specific function’s logs filtered to the same time frame you were exploring in Function Metrics.
Inspect a deploy on your chart
Section titled “Inspect a deploy on your chart”When the Invocations chart is zoomed in to 3 days or less, it includes deploy markers to help you correlate patterns in your metrics with changes to your production code. Deploy markers are displayed as grey vertical lines in the chart.
To inspect deploys, do the following:
-
Make sure the Invocations chart is zoomed in to 3 days or less so that deploy markers are included in it.

-
Select a deploy marker to reveal a description based on the pull/merge request title or commit message.

-
Use the link on the deploy description to go to the relevant deploy details page where you can find a deploy summary and deploy log.
Data retention and freshness
Section titled “Data retention and freshness”Metrics are retained for at least 7 days even after new function deployments. The metric retention period increases to 30 days for Core Pro and Enterprise plans.
We update Function Metrics data on an ongoing basis. There are a few minutes of delay between when an invocation completes and when the metrics data is updated. You will need to refresh your browser to load the updates.
Limitations
Section titled “Limitations”Function Metrics do not include data for the following:
- On-demand Builders
- Background Functions
- local invocations triggered while running
netlify devornetlify functions:serve
Next steps
Section titled “Next steps”After identifying patterns, trends, spikes, or other points of interest with Function Metrics you can go deeper with other monitoring tools knowing you’re focusing your efforts on impactful areas.
- Function logs. Examine per-invocation log statements and messages in a filterable interface.
- Log Drains. Perform flexible queries in third-party monitoring services.
Did you find this doc useful?
Your feedback helps us improve our docs.