Netlify Observability offers near real-time visibility into your project’s production performance and resource usage. Monitor requests, bandwidth, runtime behavior, functions, and Edge Functions to understand how your web project operates in production, fix errors, and optimize web performance.
Get started
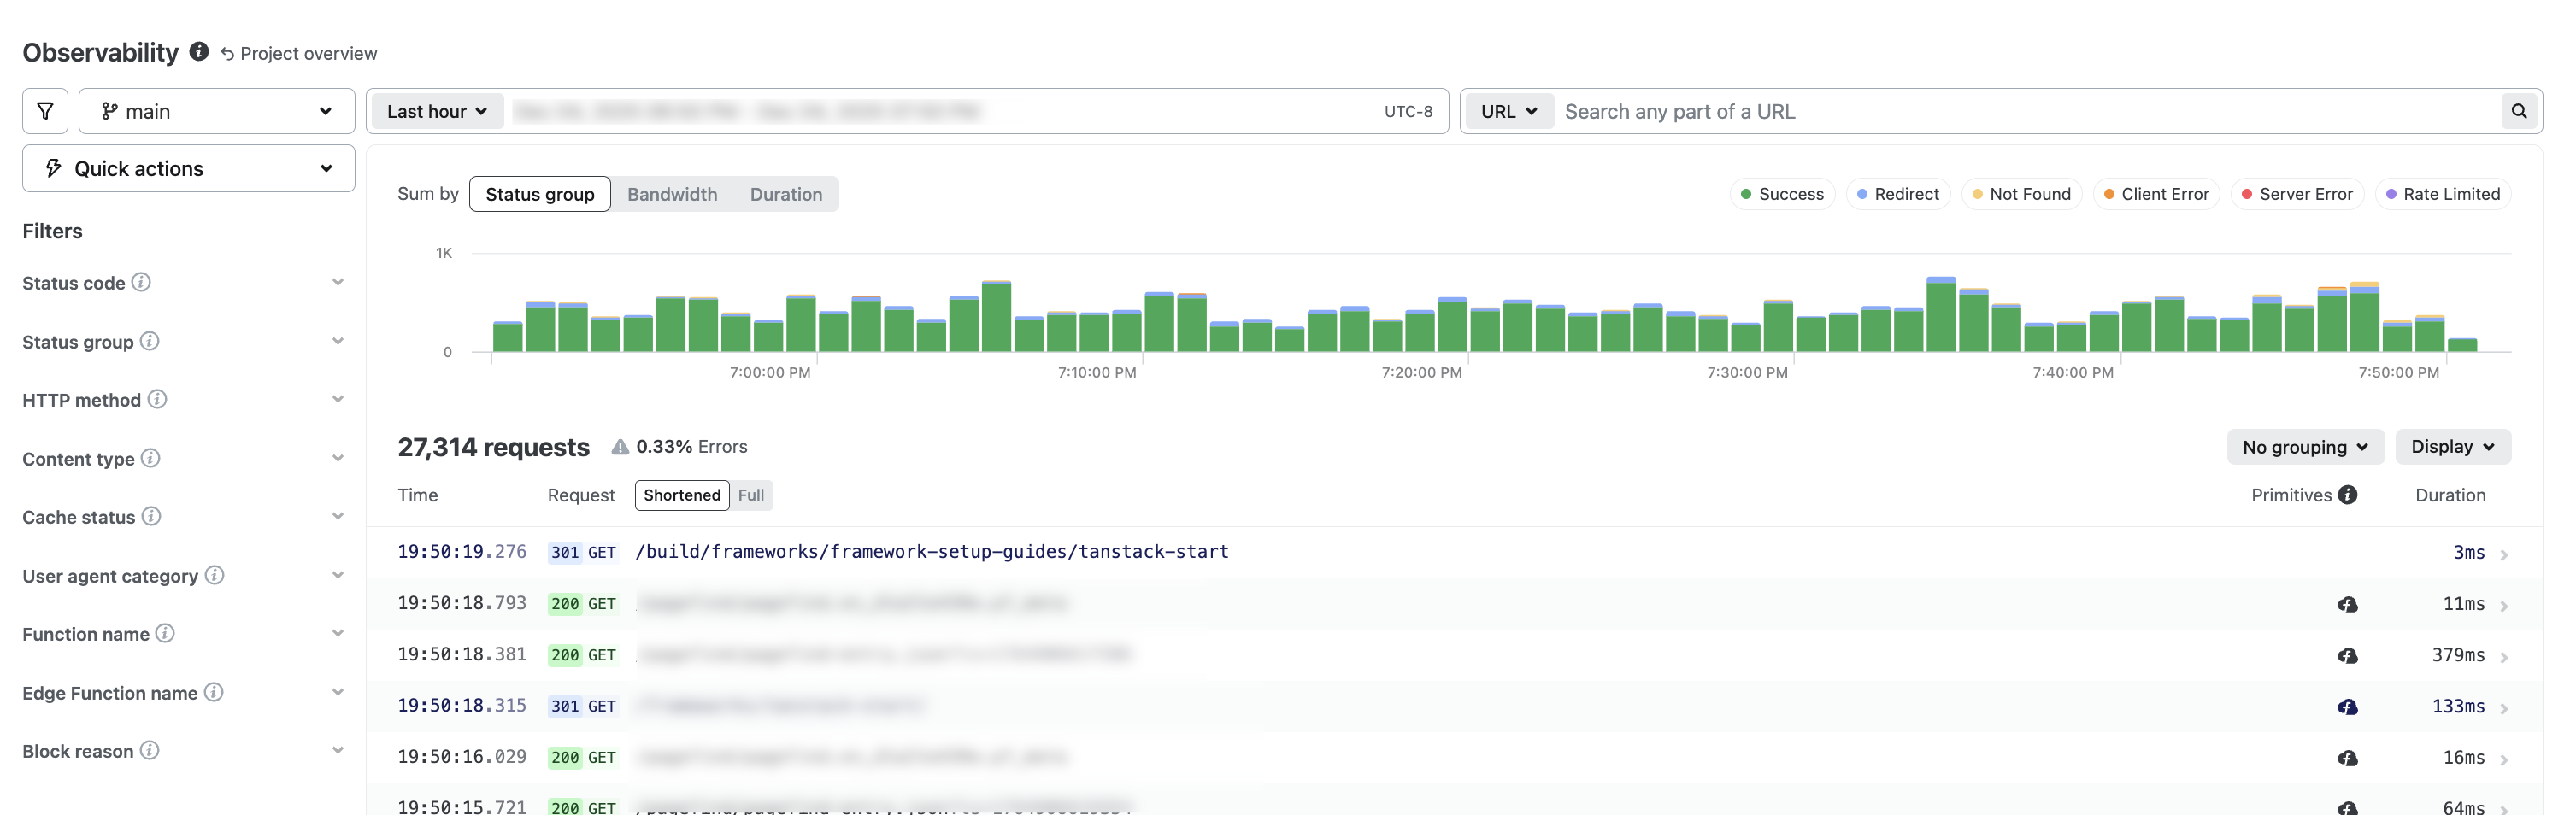
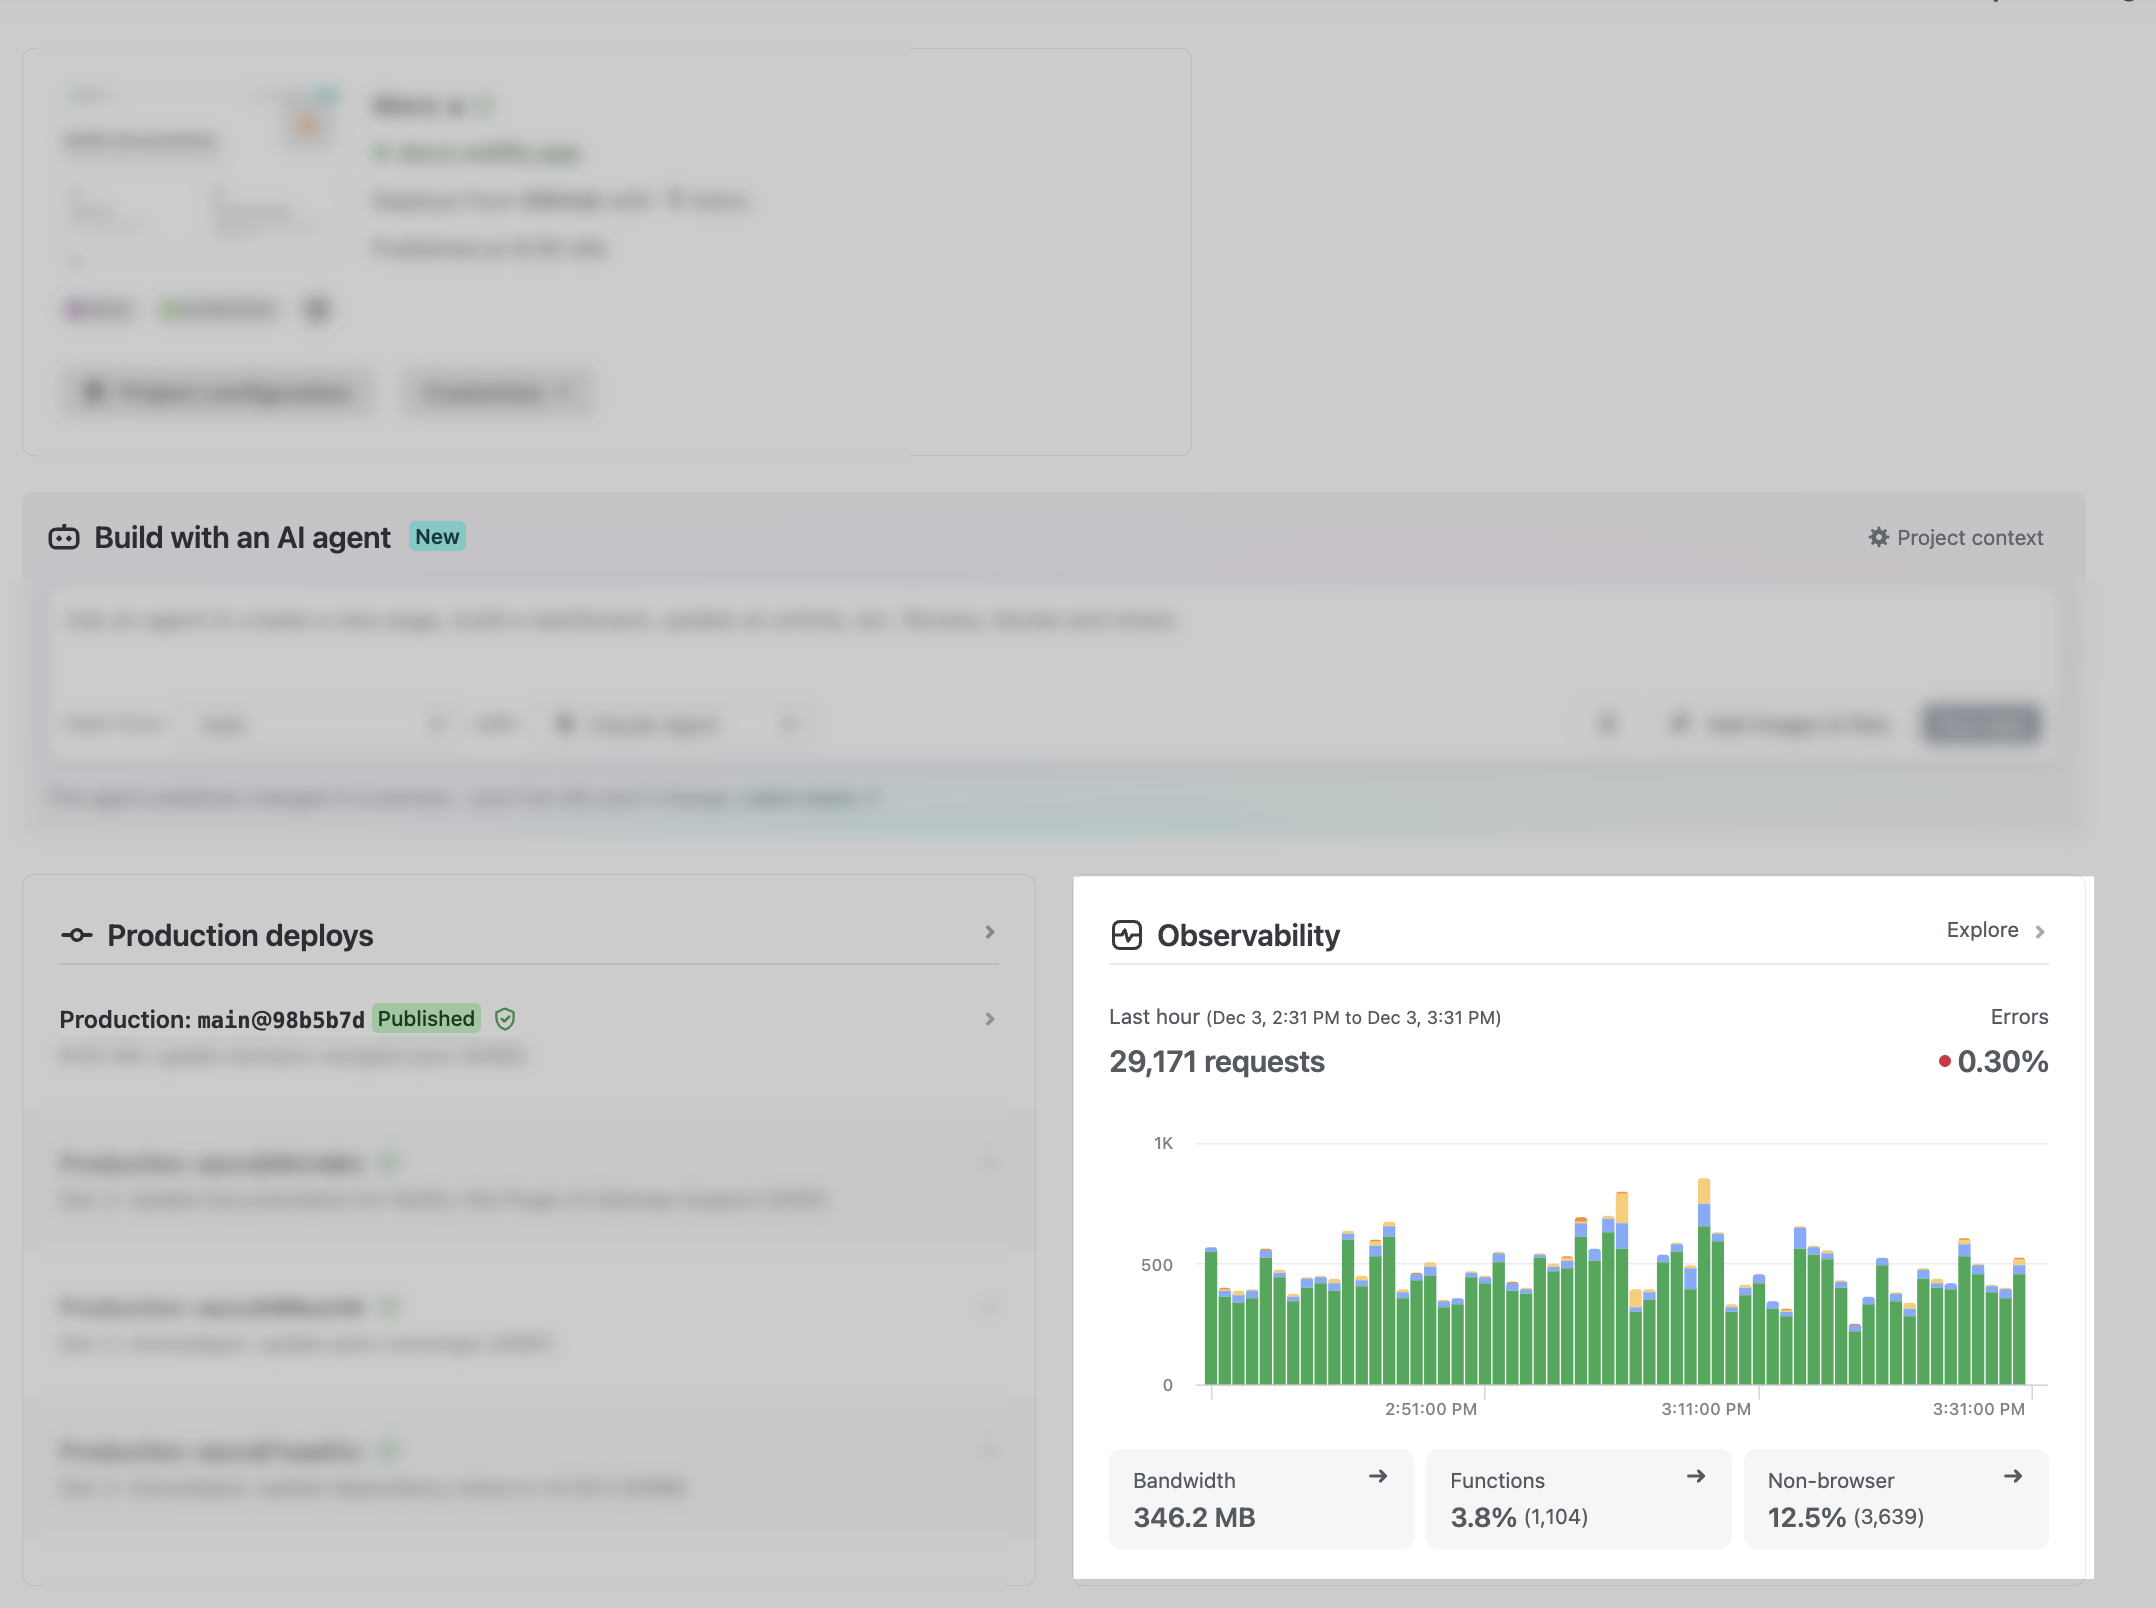
Section titled “Get started”From your project overview, select Logs & metrics > Observability. To expand details for a request, select a request.
Use cases
Section titled “Use cases”Observability is designed to give you real-world insights into how your web project is working in production.
| Common use case | Description | Questions explored |
|---|---|---|
| Troubleshoot issues | Identify frequently requested 404 URLs and diagnose unexpected behavior. | How common are these errors? On which pages? Is this driven by real user traffic or bots and crawlers? |
| Analyze traffic patterns | Detect AI crawler activity and bot traffic. | What kinds of site visitors or requests is your site getting? |
| Optimize performance | Identify which resources are using the most bandwidth. Find cache misses on critical endpoints, assets consuming excessive bandwidth, over-invoked functions, and edge logic running in unintended regions. | Which resources are using the most bandwidth? What’s driving up serverless function usage? |
Note that Observability shows you how your project is working in production but does not show you credits usage. To understand your credits and billing, check out our usage and billing docs.
Use case videos
Section titled “Use case videos”Learn how to use Observability to troubleshoot issues, analyze traffic patterns, and optimize performance from the following tutorial videos.
Availability
Section titled “Availability”Observability is available for Credit-based plans and Enterprise plans. If you have a Legacy pricing plan, you can get a sneak peek at your observability data by checking out the widget from your Project Overview.
| Credit-based plan | Time filter available |
|---|---|
| Free | Past 24 hours |
| Personal | Past 24 hours |
| Pro | Past 7 days |
| Enterprise plan | Time filter available |
|---|---|
| Any Enterprise plan | Past 30 days |
Note that if you have a Credit-based plan or an Enterprise plan, then Function Metrics will no longer be available to you as it is replaced by Observability. On plans that do not have Observability, Function Metrics continues to be available.
If you’re interested in switching to a Credit-based plan or upgrading to a higher Credit-based plan, check out Change your pricing plan.
Quick insights
Section titled “Quick insights”Use the Quick actions menu to quickly check for insights with a set of pre-selected filters across traffic, bandwidth, and compute.
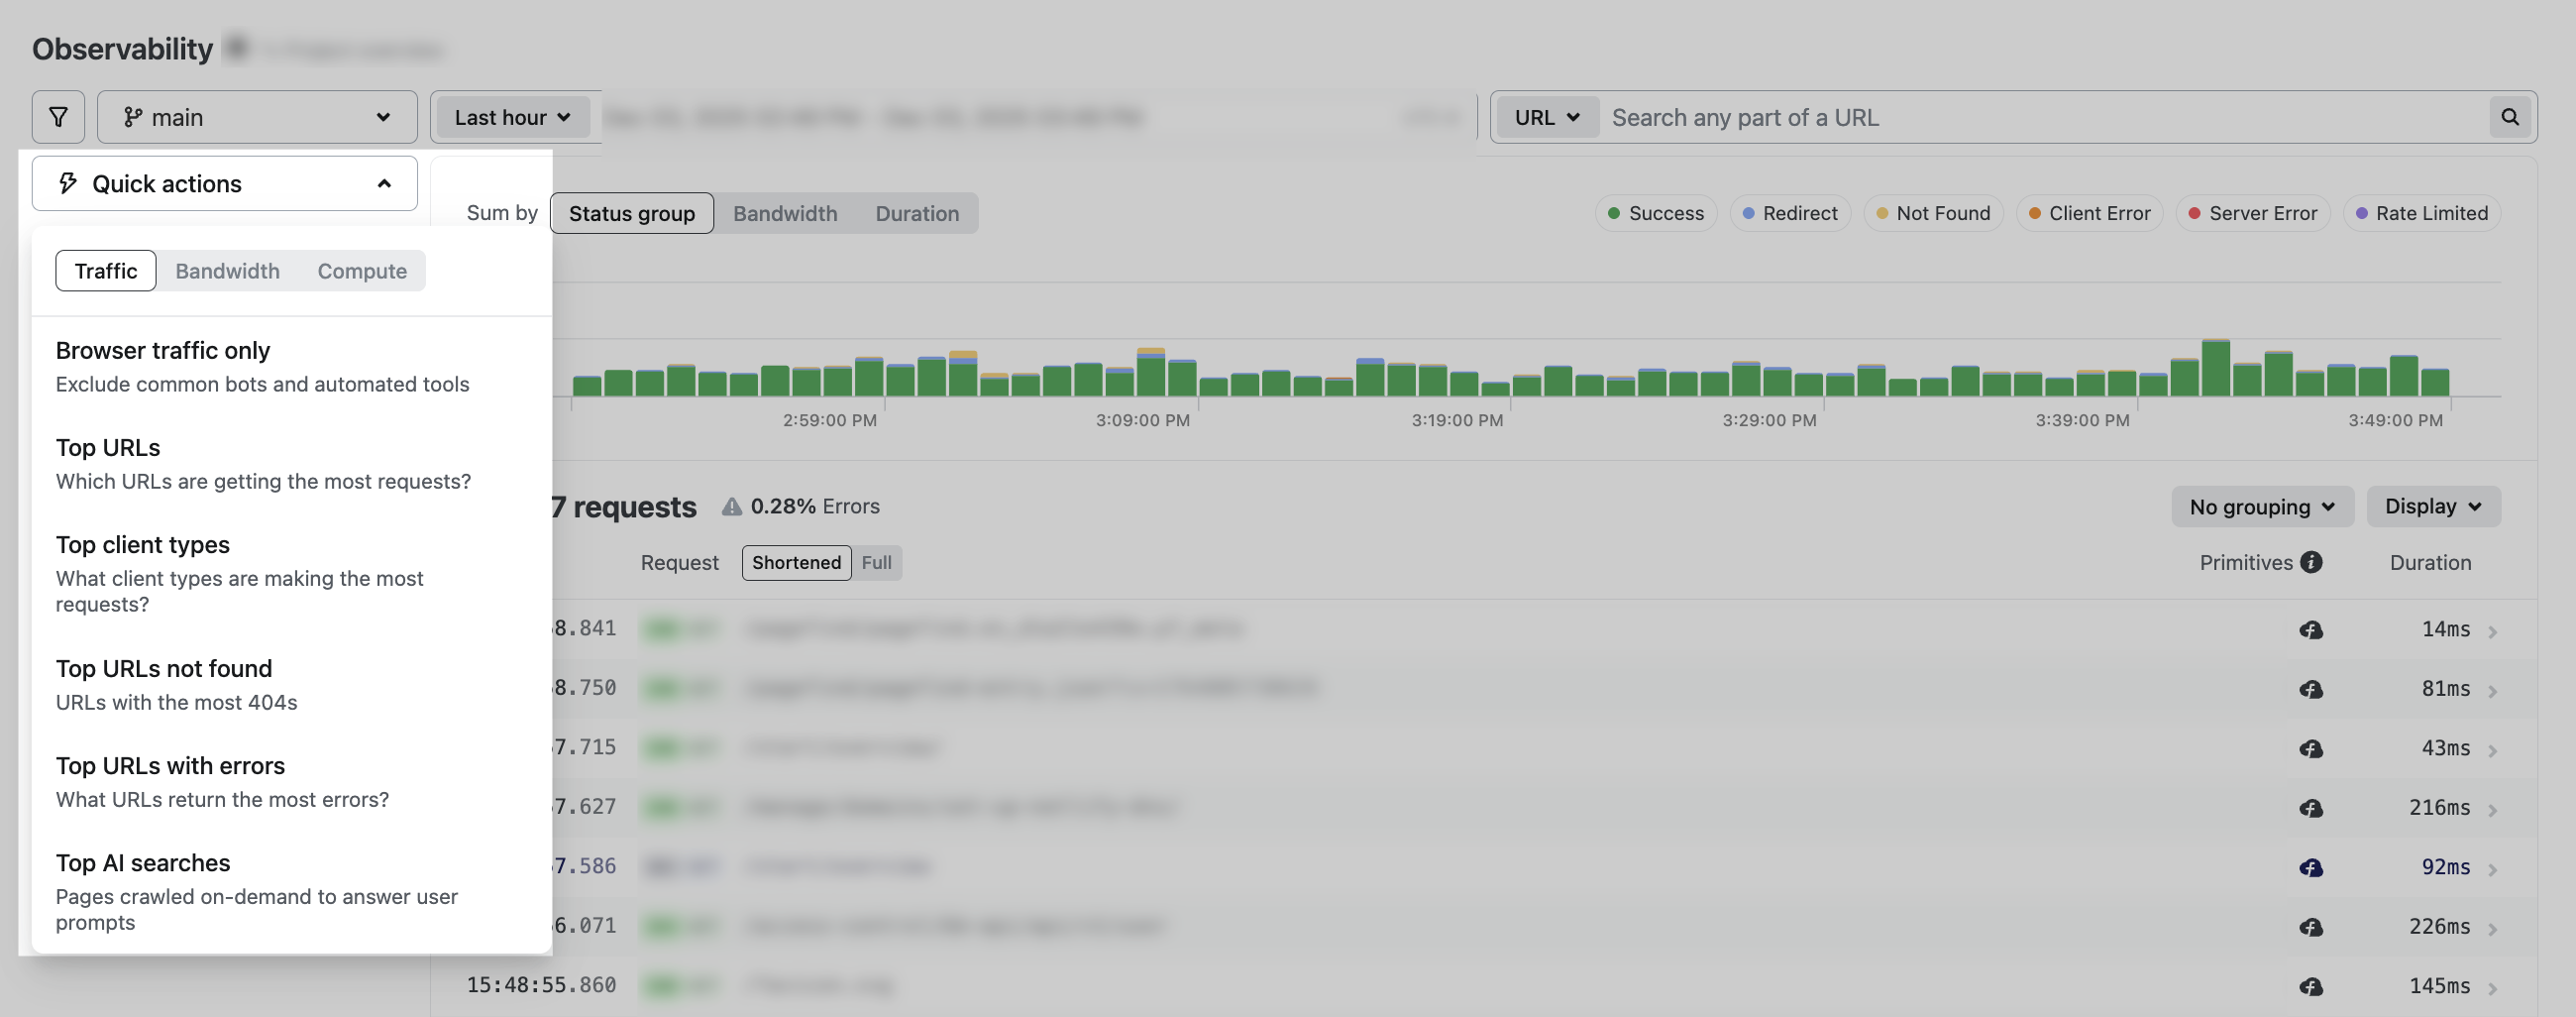
Traffic insights
Section titled “Traffic insights”| Selected filters for | Description |
|---|---|
| Browser traffic only | Exclude common bots and automated tools |
| Top URLs | Which URLs are getting the most requests? |
| Top client types | Which client types are making the most requests? |
| Top URLs not found | URLs with the most 404s |
| Top URLs with errors | Which URLs return the most errors? |
| Top AI searches | Pages crawled on-demand to answer user prompts |
Bandwidth insights
Section titled “Bandwidth insights”| Selected filters for | Description |
|---|---|
| Bandwidth by URL | Which routes use the most bandwidth? |
| Bandwidth by client type | Which client types are using your bandwidth? |
| Bandwidth by content type | Which types of content are using your bandwidth? |
Compute insights
Section titled “Compute insights”| Selected filters for | Description |
|---|---|
| Top functions | Which Netlify Functions are invoked the most? |
| Slowest URLs | Which URLs are the slowest to respond? |
| Top client types invoking functions | Which client types invoke the most functions? |
Blocked requests
Section titled “Blocked requests”You can also learn more about the types of requests that are blocked by Netlify’s security features.
Netlify’s Observability will not show you certain kinds of blocked requests, such as requests blocked by a CDN, proxy service, or Netlify’s automated DDoS protection. Learn more about blocked requests.
Understand request counts
Section titled “Understand request counts”Netlify Observability shows raw server-side HTTP request data. This may differ from metrics in other tools you use, which measure different aspects of your site’s traffic.
Differences from web analytics tools
Section titled “Differences from web analytics tools”Web analytics tools like Google Analytics measure traffic differently than our observability dashboard:
- Bot filtering: Analytics tools filter out bot traffic to show only human visitors. Our dashboard shows all requests, including bots.
- Page views vs. requests: Analytics tools count single-page app (SPA) navigation as separate page views, even though they don’t trigger new requests. Our dashboard only counts actual HTTP requests.
- Client-side vs. server-side tracking: Analytics tools run in the browser and can’t see failed requests (404s) or redirects (301s, 302s) because the page never fully loads. Our dashboard tracks all requests at the server level, including errors and redirects.
- Visitors and sessions: Analytics tools use heuristics and cookies to estimate unique visitors and sessions. Our dashboard doesn’t track these metrics—it shows raw HTTP request data and how our platform handles them.
Impact of CDN or proxy services
Section titled “Impact of CDN or proxy services”If you use a CDN or proxy service (like Cloudflare or Akamai) in front of your site, blocked or cached traffic may never reach our platform. The dashboard only measures requests that actually arrive at our servers.
Search & filter options
Section titled “Search & filter options”The following search and filter options allow you to create custom views of your project’s observability data.
Search options
Section titled “Search options”Use Observability’s search field to filter web requests by the following:
- The request URL (including domain or query params)
- The user-agent string
- Client IP address (if the request went through a trusted proxy—the IP is what the proxy reports as “forwarded for”)
- The request ID—each response from Netlify includes a header with a unique ID for that request
- Any text in function and edge function logs
Filter options
Section titled “Filter options”Observability filters allow you to group requests by different criteria to gain insights into your project’s behavior.
| Filters | Description |
|---|---|
| Status codes | Web standards-defined filter to group requests by HTTP status codes. |
| Status group | Custom Netlify filter to group status codes. Instead of using the HTTP standard status classes (such as informational for 1xx, successful for 2xx, redirect for 3xx, client error for 4xx, and server error for 5xx), Netlify groups status codes into 5 groups: Success, Redirect, Not Found, Client Error, and Server Error. |
| HTTP method | Web standards-defined filter to group requests by HTTP method, including GET, POST, PUT, DELETE, etc. |
| Content type | Web standards-defined filter to group requests by content type, including text/html, application/json, application/xml, etc. |
| Cache status | Custom Netlify filter to group requests by cache status based on Netlify caching. |
| User agent category | Custom Netlify filter to group requests by user agent category, including bot, crawler, etc. |
| Function name | Custom Netlify filter to group requests by function name for functions in netlify/functions. |
| Edge function name | Custom Netlify filter to group requests by edge function name for edge functions in netlify/edge-functions. |
| Block reason | Custom Netlify filter to group requests by the reason Netlify blocked a request, including rate limited, firewall traffic rules, web application firewall (WAF), password protection, and more. |
Observability vs. Log drains
Section titled “Observability vs. Log drains”| Feature | Observability | Log Drains |
|---|---|---|
| Primary purpose | Real-time debugging and performance analysis | Long-term log retention and cross-platform aggregation |
| Interface | Netlify-native dashboard | Third-party tools (Datadog, Splunk, etc.) |
| Configuration | Enabled by default | Requires endpoint setup and authentication |
| Data available | Request-level traffic, cache status, regional latency, function execution | Raw log streams: traffic, functions, edge functions, deploys, WAF rules |
| Data retention | Short-term (varies by plan) | Determined by external provider |
| Correlation | Built-in request tracing and timeline view | Depends on external tool capabilities |
| Cost model | Included with Netlify plan | External tool pricing applies |
| Cross-project analysis | Single-site view only | Aggregate multiple sites and services |
| Alerting | Not available | Configure in external tool |
| Compliance & audit | Limited retention | Supports compliance workflows and SIEM integration |
Limits and other restrictions
Section titled “Limits and other restrictions”If you need alerting, long-term data retention, or custom dashboards, we recommend setting up a log drain to connect to a third-party monitoring tool with longer log retention. Learn more about log drain support.
Other restrictions
Section titled “Other restrictions”- Requests blocked by automated mechanisms that the user cannot control or configure in any way (and that are not visible elsewhere to users) do not appear in Observability.
- Requests blocked by Advanced Web Security (by WAF, Firewall Traffic Rules, or Rate Limiting rules defined by the customer) do appear.
- Calls to AI Gateway from Agent Runners are not shown in Observability
- Credits usage is not shown in Observability but you can find your credit usage in your billing dashboard. Monitoring your project in the Observability dashboard does not add any new usage charges. Learn more in Monitor usage for credit-based plans.
- There is currently no programmatic access to observability data.
- Granular caching information
- Debugging specific issues at depth, e.g., Incremental Static Regeneration (ISR) behavior with Next.js, often requires granular caching information not shown today.
- Observability is not available for Legacy pricing plans and replaces Function Metrics.
Did you find this doc useful?
Your feedback helps us improve our docs.