Overview
Section titled “Overview”Real User Monitoring allows you to understand and prioritize the real-world experience of your site visitors.
With Real User Monitoring, you can identify the production deploys that most impact your site’s usability and understand site performance based on Web Vitals that rely on real user interactions with your production site.

Real User Monitoring surfaces the following Web Vitals based on real user interactions with your site.
| Web Vitals Metric | Measurement focus | Quick definition |
|---|---|---|
| Largest Contentful Paint (LCP) | Loading experience for largest assets | How quickly the page completely loads |
| First Input Delay (FID) | Interactivity and responsiveness | How quickly the browser responds to a user interaction that relies on JavaScript, such as a click or tap |
| Interaction to Next Paint (INP) | Responsiveness as the latency of a user’s click, tap, or keyboard interaction | How quickly the page responds to user interaction. Learn more about INP at the web.dev docs. |
| Cumulative Layout Shift (CLS) | Visual stability | How much the layout changes as a proxy for the visual stability of your site |
| First Contentful Paint (FCP) | Loading speed | How quickly the first parts of a page load |
These metrics are based on user-centric Web Vitals and include Core Web Vitals. Learn more about these metrics from web.dev.
How Real User Monitoring are collected
Section titled “How Real User Monitoring are collected”Real User Monitoring collects user-centric Web Vitals based on real site vistor activity and aggregates this data for you along with production deploy details.
Unlike Lighthouse, which relies on synthetic testing, Real User Monitoring takes a real user monitoring approach.
Once a Team Owner or Developer enables Real User Monitoring for your site, Netlify injects a JavaScript snippet into the HTML of your production site to collect these Web Vitals events.
The JavaScript snippet is minified and injected with an async attribute before the closing </body> tag and so it’s expected that there will be very little to no detected impact to site performance for users.
Once enabled, Real User Monitoring does not require additional configuration or cookies on the client browser. Note that Ad blockers do not prevent Real User Monitoring from being collected.
Real User Monitoring is best for busy sites with many visitors as it aggregates site visitor experiences. This avoids the subway effect, where one user on a subway who experiences a poor web experience doesn’t dramatically offset the results.
For a deeper understanding of your site performance, we recommend using Netlify’s analytics tools together. Here’s a quick overview of how these tools compare.
| Real User Monitoring | Web Analytics | Lighthouse |
|---|---|---|
| Offers overview of site usability based on site visitor interactions and user-centric Web Vitals | Offers general overview of site usage, such as pageviews, number of unique visitors, top locations, etc. with adjustable time scales | Offers usability scores based on Web Vitals |
| Only for production site | Only for production site | Can apply to all site deploys |
| Gives insights after deploying to production | Gives insights after deploying to production | Gives insights before deploying to production and after |
| Most useful for high traffic sites | Useful for any site | Useful for any site |
| Offers real-world insights | Offers real-world insights | Offers insights based on synthetic testing |
Enable Real User Monitoring for your site
Section titled “Enable Real User Monitoring for your site”To enable Real User Monitoring for your site:
- From your Site overview page, go to Logs & Metrics Real User Monitoring.
- Select Enable Real User Monitoring.
After you enable Real User Monitoring for your site, data collection will start the next time your site is visited.
Real User Monitoring data is populated in your charts in one hour increments.
Be aware that your data will not populate until people first visit your site. So if no one visits your site, then your charts will stay empty with no data.
Data is not backfilled, and is collected on production deploys only.
If you turn off Real User Monitoring for your site, you lose the metrics on your Real User Monitoring dashboard. If you turn Real User Monitoring back on, you must wait for new data to update your dashboard.
Inspect a deploy on your chart
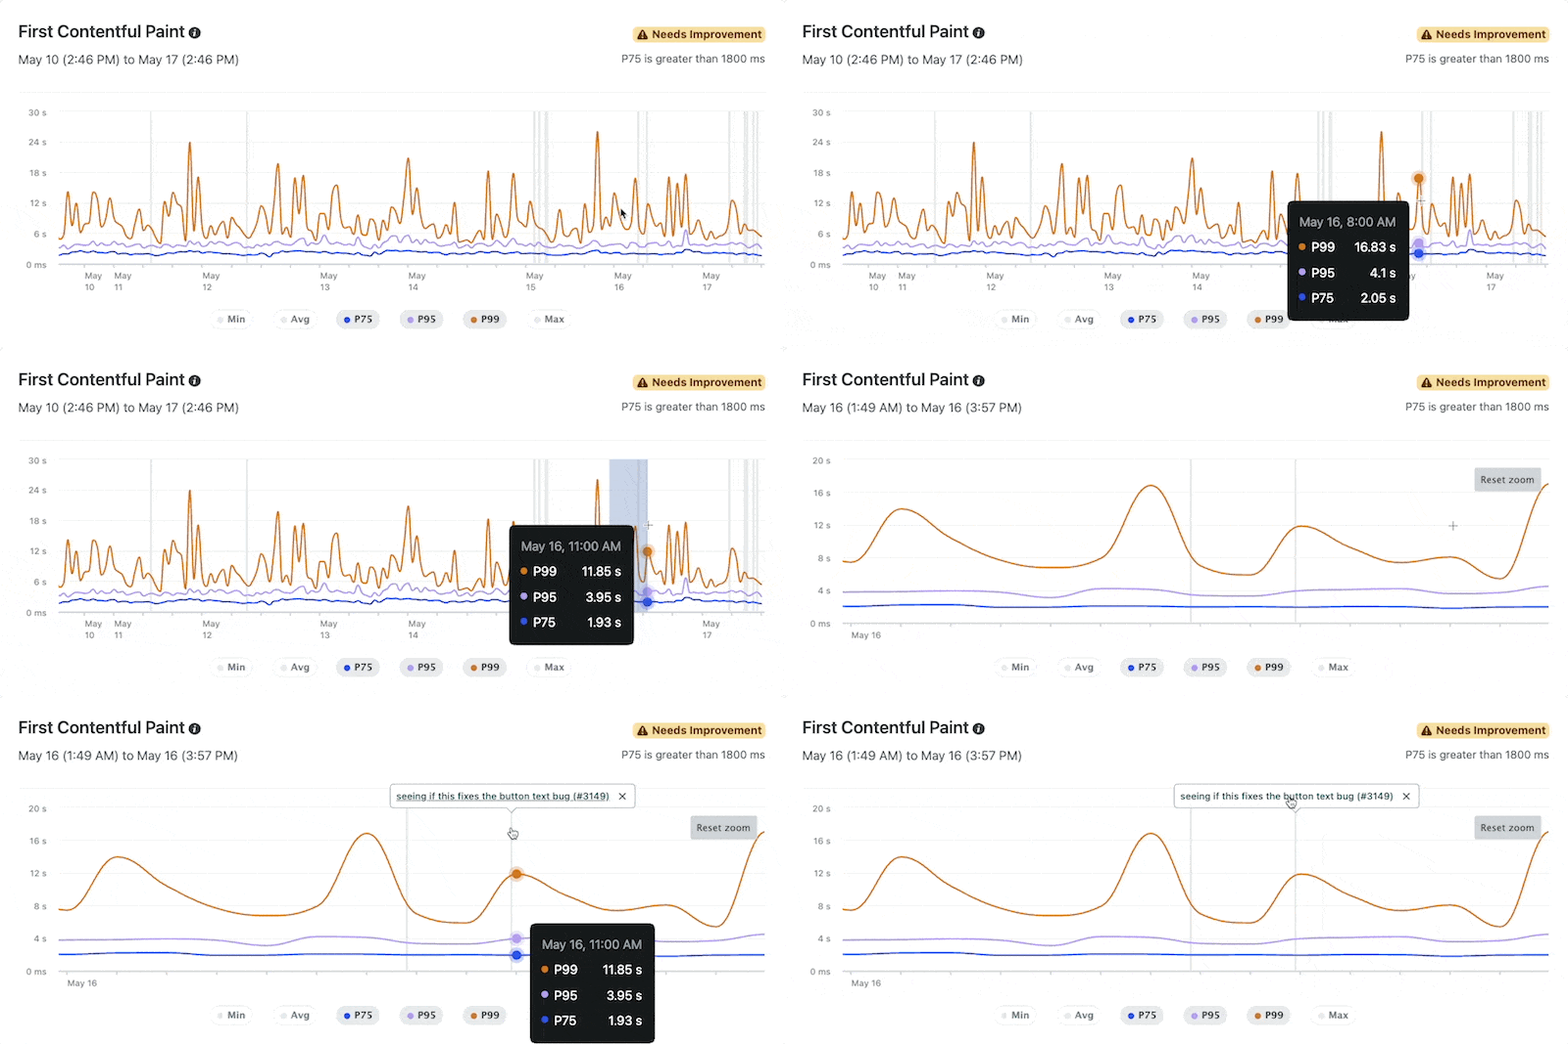
Section titled “Inspect a deploy on your chart”Expand details about a specific production deploy from your Real User Monitoring Chart to understand how your deploy impacts the real-world experience of your site visitors.
To inspect a specific deploy from a chart:
-
Select a gray column (also called a deploy marker) in your chart.
 Once you select a deploy, the deploy description appears based on a pull/merge request or commit message.
 -
To open the deploy details page for your selected deploy, select the deploy description text. The deploy details page offers a deploy summary and your deploy log.

Review Real User Monitoring for different sites
Section titled “Review Real User Monitoring for different sites”To quickly review Real User Monitoring for different sites, use the site switcher to change site data for your Real User Monitoring dashboard.

Note that Real User Monitoring must be enabled for each site individually.
Filter your data
Section titled “Filter your data”Find the specific events and performance metrics that matter most to you with the following filters:
- Timeframe
- Device type
- Percentiles
Timeframe
Section titled “Timeframe”By default, Real User Monitoring charts are scoped to the last 7 days.
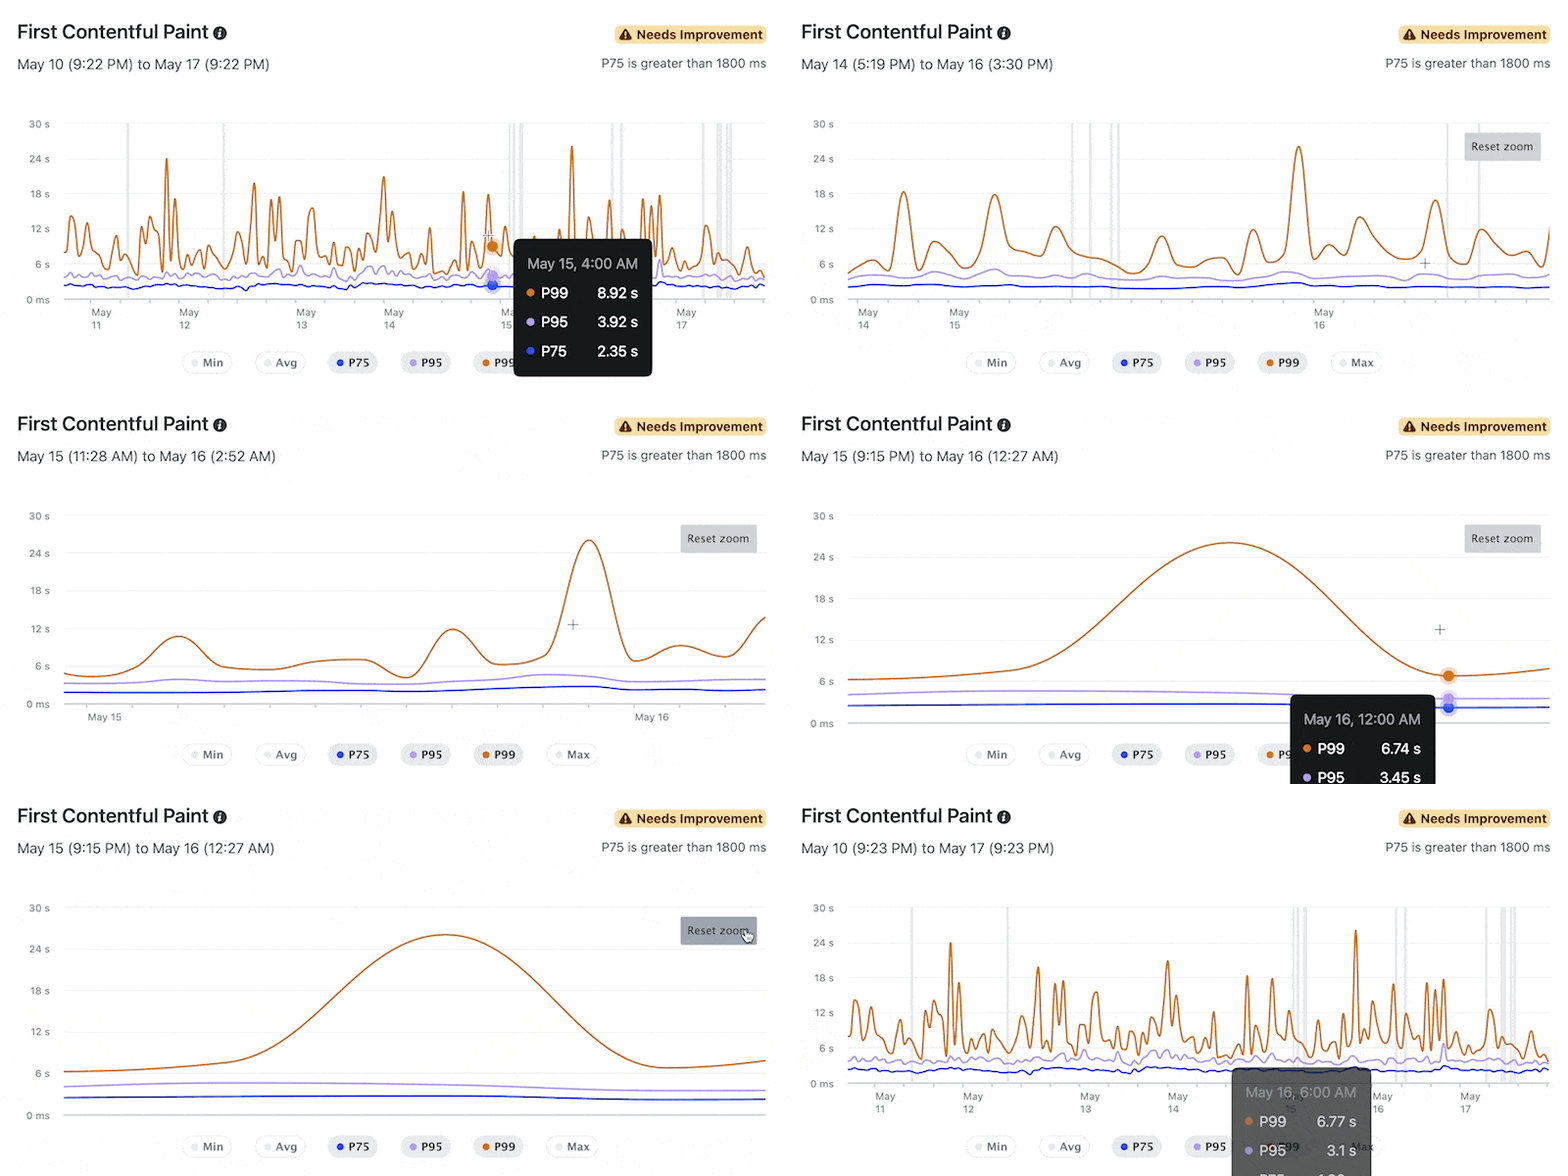
To review your metrics in a more granular timeframe, you can click and drag your desired time frame in a Real User Monitoring chart.

Device types
Section titled “Device types”By default, the Real User Monitoring charts are scoped to an aggregate from all device types.
To understand how your site performs on different device types, use the device filter above your charts to scope data to mobile or desktop devices.
Percentiles
Section titled “Percentiles”By default, the Real User Monitoring charts will display scores for the 75th, 95th, and 99th percentiles of all of your site’s page loads. You can expand details for the minimum, average, and maximum metric results.
To focus on the percentiles that matter most to you, choose which percentiles to feature in all of your site’s Real User Monitoring charts. To set your chart percentiles, select one or more percentiles at the bottom of any chart.

Understand your scores
Section titled “Understand your scores”Each Real User Monitoring category (LCP, CLS, INP, FID, FCP) has a score range for acceptable performance.
To help you quickly gauge your site’s performance, we apply score status badges to each chart using Good, Mid, Poor, or Needs improvement.

When calculating the overall status of LCP, CLS, INP, FID, FCP for your production site, Netlify only considers metrics within the 75th percentile of all of your production site’s page loads.
| Score category | Good range | Mid range | Poor range |
|---|---|---|---|
| Largest Contentful Paint (LCP) | < 2500 ms | 2500 - 4000 ms | > 4000 ms |
| Cumulative Layout Shift (CLS) | < 0.1 | 0.1 - 0.25 | > 0.25 |
| Interaction to Next Paint (INP) | < 200 ms | 200 - 500 ms | > 500 ms |
| First Input Delay (FID) | < 100 ms | 100 - 300 ms | > 300 ms |
| First Contentful Paint (FCP) | < 1800 ms | 1800 - 3000 ms | > 3000 ms |
Improve your scores and your site’s user experience
Section titled “Improve your scores and your site’s user experience”Improve the user-centric Real User Monitoring for your site by checking out these guidelines from web.dev.
Content Security Policy support
Section titled “Content Security Policy support”If your site is using a Content Security Policy (CSP), you must add script-src netlify-rum.netlify.app to your CSP rule in your _headers or netlify.toml file to ensure Real User Monitoring can run for your site.
Example _headers file
Section titled “Example _headers file”/* Content-Security-Policy: [...] script-src https://netlify-rum.netlify.appExample netlify.toml file
Section titled “Example netlify.toml file”[[headers]] for = "/*" [headers.values] Content-Security-Policy = "[...] script-src https://netlify-rum.netlify.app"Learn more about using the Content Security Policy.
Troubleshoot Real User Monitoring
Section titled “Troubleshoot Real User Monitoring”If you are not finding any Real User Monitoring data for a site, consider the following:
- Does your site have a Content Security Policy (CSP)? If so, you’ll need to make an update to your CSP configuration.
- Does your site get very little traffic? If so, be aware that your data will not populate until people first visit your site.
Disable Real User Monitoring
Section titled “Disable Real User Monitoring”Once disabled, Real User Monitoring charts for your site will no longer be available.
If you decide to turn Real User Monitoring back on, you need to wait for new Real User Monitoring data since your charts will not backfill data.
To disable the Real User Monitoring service for a site, go to Logs & Metrics Real User Monitoring. At the bottom of the page, select Disable Real User Monitoring.
Did you find this doc useful?
Your feedback helps us improve our docs.